Improve
Updates for Rock 6.0
Below is a summary of the updates for this version.
- Documented the new flexible series partition features.
- Added information on the new service metric entry block.
Updates for Rock 1.0
No updates made.Updates for Rock 2.0
No updates made.Updates for Rock 3.0
No updates made.Updates for Rock 4.0
Below is a summary of the updates for this version.
- Documented the Page Title Lava feature on the Dynamic Data block.
- Added chapter on the new Dynamic Report block... yum!
Updates for Rock 5.0
Below is a summary of the updates for this version.
- Documented new settings on the Dynamic Data block.
Updates for Rock 7.0
Below is a summary of the updates for this version.
- Added Lava as a metrics data source type and provided examples of how organizations might utilize it in reporting.
- Added new post-filter transformation options.
- Added Business Intelligence chapter.
- Added information about filtration control for multiple data views.
- Updated Edit Metrics screenshot and bullet points.
- Updated Dynamic Data Block screenshot and callouts with Encrypted Fields info.
Updates for Rock 8.0
Below is a summary of the updates for this version.
- Updated Dynamic Data Block screenshot and callouts with Encrypted Fields info.
- Added Age Classifications section to Filtering Using Data Views chapter.
- Updated Post-Filter Transformations to include Family Members.
- Documented new options on Dynamic Report block
Updates for Rock 9.0
No updates made.Updates for Rock 10.0
Below is a summary of the updates for this version.
- Added Page Parameter Filter block
Updates for Rock 11.0
Below is a summary of the updates for this version.
- Added ability to view performance and frequency information for Data Views
- Data Views that apply to Person records have an "Include Deceased" option
Updates for Rock 12.0
Below is a summary of the updates for this version.
- Updated the Report Detail block to show time to
run and run count similar to the Data View Detail
block
- Data View Results is now its own block, which introduces an option to launch a workflow from a Data View Results grid
- The Dynamic Data block has a new setting to allow for automatic inclusion of a panel
- Data Views that return people can be partitioned by Campus in Metrics
- The Service Metric Entry block now has additional filtering block settings
Updates for Rock 13.0
Below is a summary of the updates for this version.
- The Page Parameter Filter block has a setting to allow for no update, block update, or page updates when filters are updated
- The Calculate Metrics job has a new Command Timeout setting that lets you control how long the process will run before timing out when calculating SQL-based metrics
- Data Views have new "Head of Household" and "Giving Leader" Post-filter Transformations
Updates for Rock 14.0
Below is a summary of the updates for this version.
- Metrics can now be calculated on demand using the new Run Now feature
- A new Unit Type setting lets you indicate if your metric is tracking numbers, currency or percentages
Updates for Rock 15.0
Below is a summary of the updates for this version.
- Data Views can be persisted at regular intervals or on a schedule
Updates for Rock 16.0
Below is a summary of the updates for this version.
- Post-filter Transformation options include "Allowed Check-In" and "Allowed Check-In Children"
Updates for Rock 17.0
Below is a summary of the updates for this version.
-
Dynamic Data blocks let you craft the display of filtered data, providing flexible reporting
- Implemented caching logic in Data Views to improve performance
-
Measurement Classifications define metric purposes, enabling Rock
to interpret their data
Updates for Rock 18.1
No updates made.
Welcome
There's no use putting data into a system if you can't get it back out. In fact, the tools
to report and display your data are much more important than the entry tools. Rock's
reporting and analytics tools were some of the first features to hit the drawing board.
We based them on years of real-world experiences – previous successes and lessons learned.
We hope that you'll take the time to not only learn how to drive the tools, but more
importantly, how to build a successful reporting strategy that provide consistent and
reliable results.
Let's get started.
If You're Only Going To Read One Chapter
OK, now that we have your attention... Before diving into the tools let's start with a
discussion on strategy. It's tempting to want to start writing your first report. But
trust us - this chapter will save you countless hours and the embarrassment that comes
from delivering conflicting and incorrect reports.
The usual workflow for application reporting goes something like this:
-
Get a request for a report.
-
Write the report per the request.
Seems pretty logical, right? This is actually a great strategy if you only get one report
for the lifecycle of the application. Well, that's never going to happen! We all know
you'll need to write hundreds of reports over the lifetime of the application. The problem
is that many of these reports will have lots of similar requirements, with just small
differences. Eventually, you'll end up wasting a good amount of time writing almost the
same reports. If you're not careful, some of them might even conflict with each other. So
why not slow down and create a strategy of re-usable reporting components? Ok, that
sounds like a plan!
When designing Rock, we resisted the urge to rush and make a traditional ad-hoc reporting
tool. We looked back at the years of lessons learned (embarrassingly enough there are many
of them) and designed an architecture that allows you to build a reporting strategy.
What Makes Up a Report?
There are two facets to any report: filter and display criteria. Consider this example.
Your organization's leader walks in your door and asks for a list of attendees over
the age of 18 who began attending within the last two years. He would like to have
their names, contact information and the number of times they have attended. Using
this example, let's look at each of the facets of reporting.
-
Filter Criteria: These are the criteria that limit the results to
display. They answer the "Who" part of the request. In the case of the example,
the criteria would be:
-
Attendees
-
Greater than 18 years of age
-
Began attending in the last two years
-
Display Criteria: Once the results are filtered you must display
them, with the necessary attributes, to the user. In the case of our example,
these attributes might be:
-
Name
-
Phone
-
Email
-
Address
-
Number of Times Attended
Once you create your handy report for your leader, it's very likely she'll be back
asking for further changes. Perhaps now she wants another report with the same logic
but only showing females. In most systems you'll have to start over and make a copy
with the addition of the new criteria. Now you have two very similar reports to
maintain.
With Rock, we have deliberately chosen to split the filter and display activities in
reporting. You create your filters by defining
Data Views. You then
create your display by creating Reports
that use the Data Views.
Reporting Strategy
The strategy part of reporting comes from the definition of your Data Views.
It will be tempting to quick-write a very specific data view for each report.
Consider, though, that data views can extend and build off of each other. For
instance, you might create a data view that filters
Adult Members & Attendees
and then create a new data view that uses this view and adds the criteria of female
gender. You’ve now created two views that can be used for the report at-hand AND in
future reports. What’s more, if you ever need to redefine what makes an
Adult Member & Attendee,
you can change it in one place and all reports that are built off of that view will
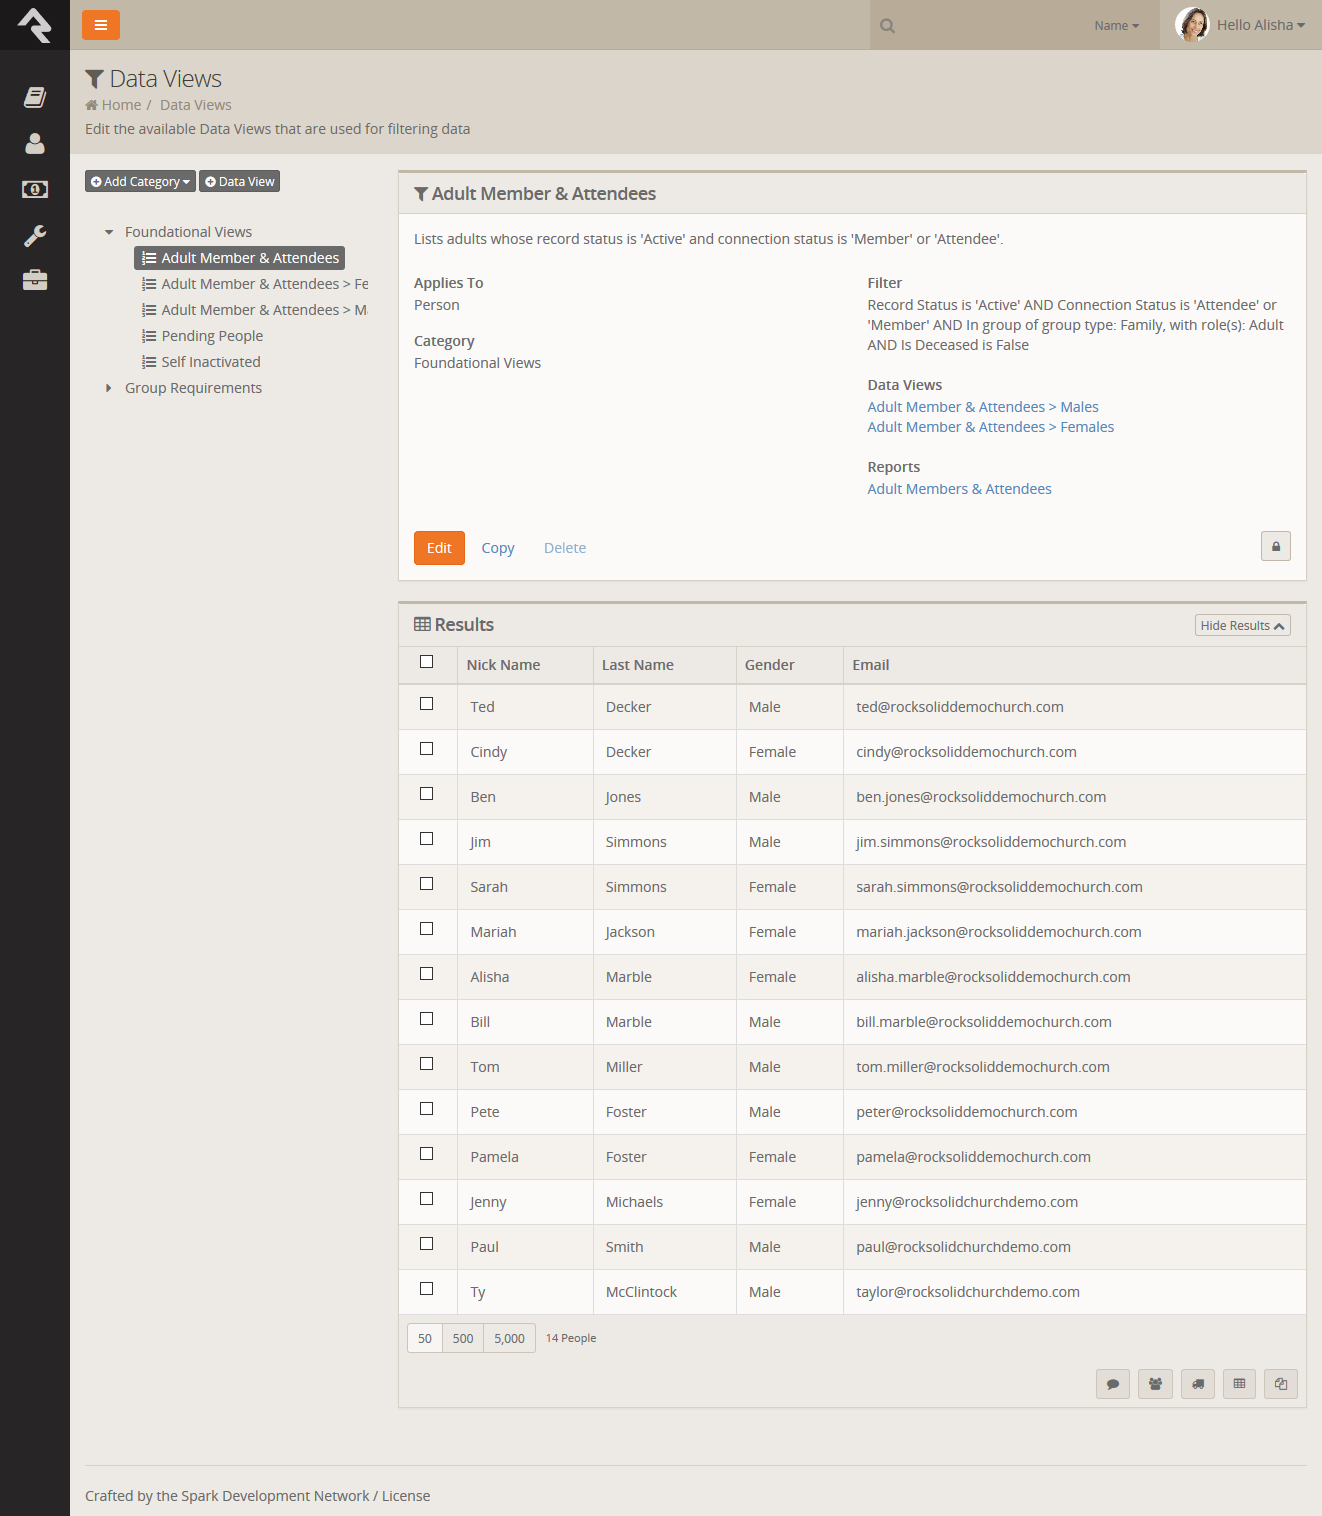
get the new definition. These two data views are available out-of-the-box with Rock.
Consider the results of these views on the Rock sample data in the figure below.
Sample Data View
Before starting any report, you should ask yourself:
-
What, if any, criteria filter in this report might be reusable in future reports?
-
What data views have I already defined that I can start with for this report?
Warning:
You can take the concept of reusable data views too far. Be sure to strike a
balance between what is reusable and being overly complex.
Don't worry - we've only scratched the surface of Rock's tools. Now let's get our
hands dirty learning about creating data views and reports as well as learning about
Rock's other tools.
Filtering Using Data Views
The bulk of your reporting will happen in Data Views. Data Views are a way to select and
filter records based on any field in the system. And by any, we mean any! For the most
part, you'll be creating views that displaye individuals and sometimes groups. Data Views
are not limited to just these two entities though. You can write a Data View for any type
of data in Rock including financial transactions (aka giving), metrics, page views,
etc.
Let's start out by looking at a couple of the Data Views that come out-of-the-box. Data
Views are configured under Tools > Data Views.
Below is a figure of the default list of data views. Over time you'll collect plenty of
data views. To help you organize them we allow you to create a hierarchical directory of
categories. The use of categories again becomes a part of your reporting strategy. What
good is a reusable data view if you can't find it when you need it?
Anatomy of a Data View
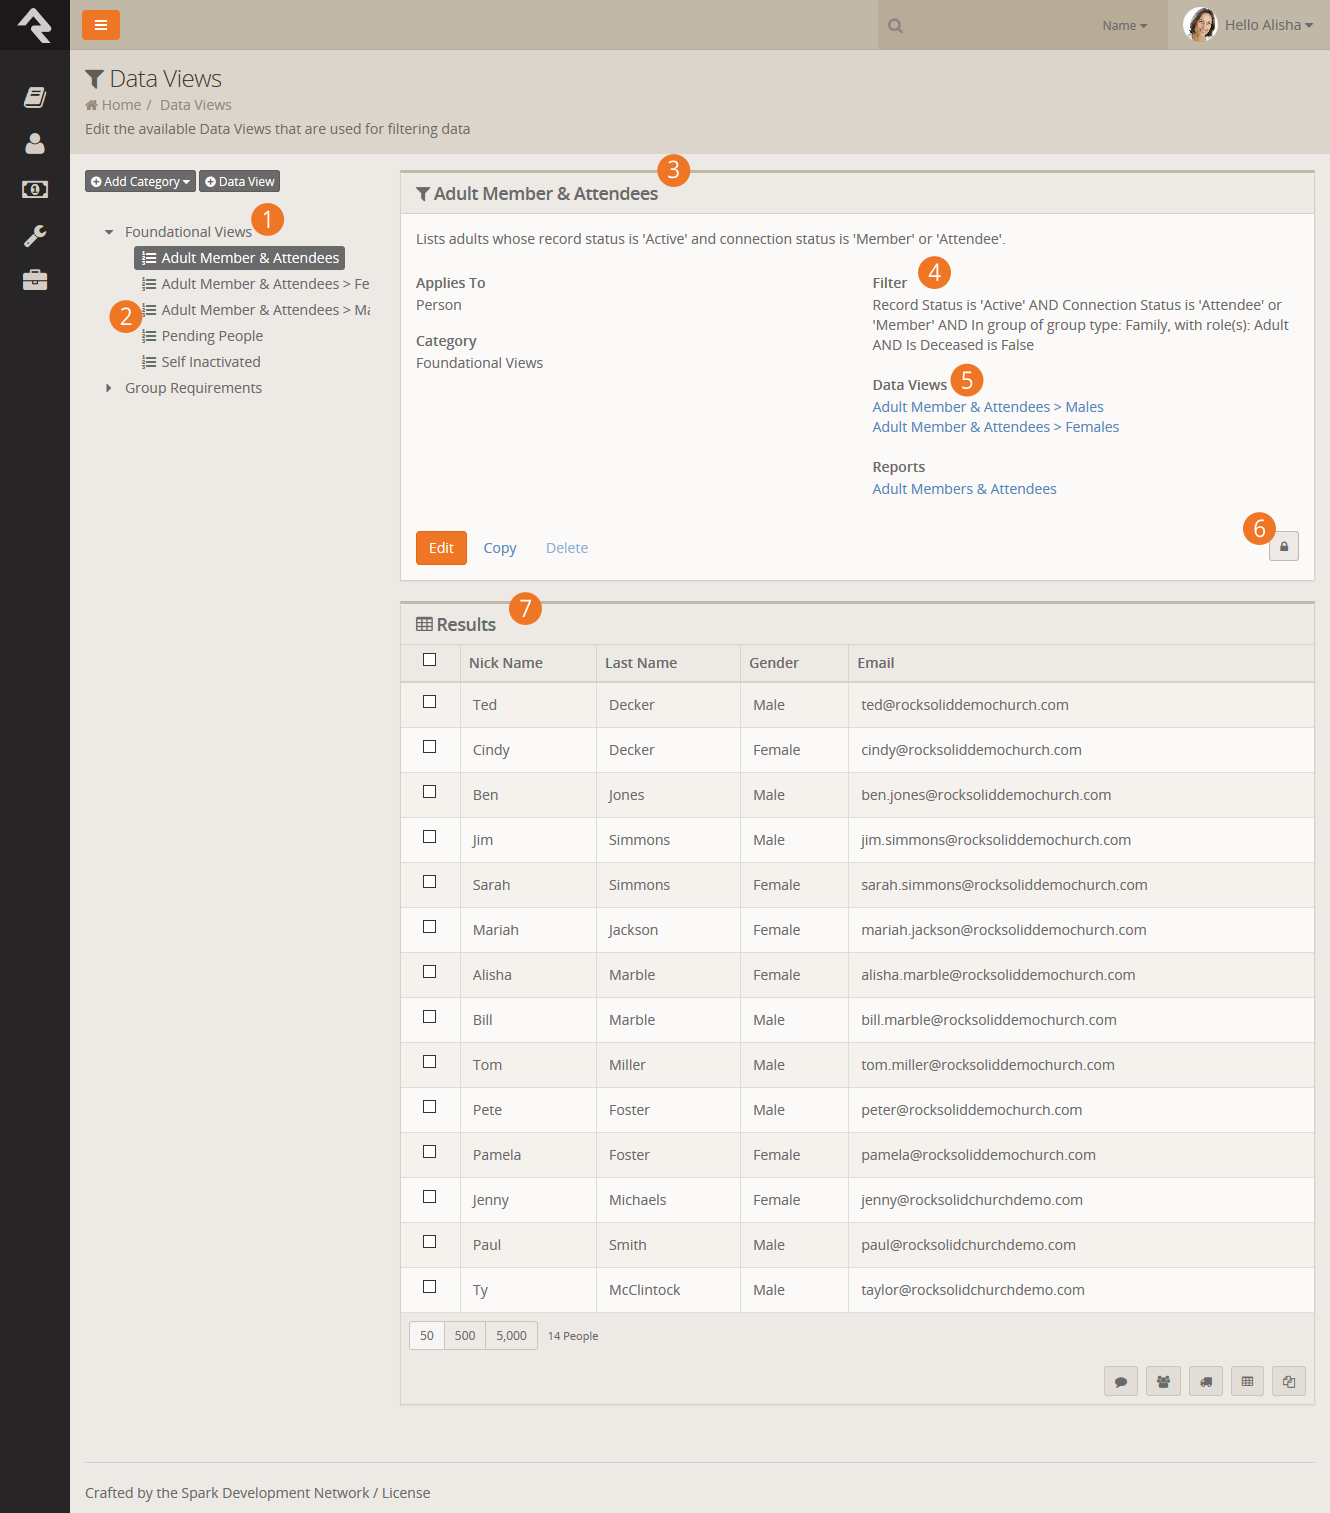
- 1 Categories
- Data views are organized into hierarchical categories.
- 2 Data View Listing
- Listing of data views in a category.
- 3 Data View Details
- Details of a data view.
- 4 Data View Filter Summary
- Note the filter summary. This is an automatically generated summary of the filters used to
create the data view.
- 5 Data Views / Reports
- Other data views and reports that are used by the current data view.
- 6 Security
- You can easily secure your dataviews to limit access to them.
- 7 Results
- The filtered results of your data view.
Now let's drill into the first data view called
Adult Members & Attendees.
As you probably guessed, this view filters adults who have the connection status of
Member
or Attendee.
It also only returns only active records. Click the Edit
button to see how this data view is configured.
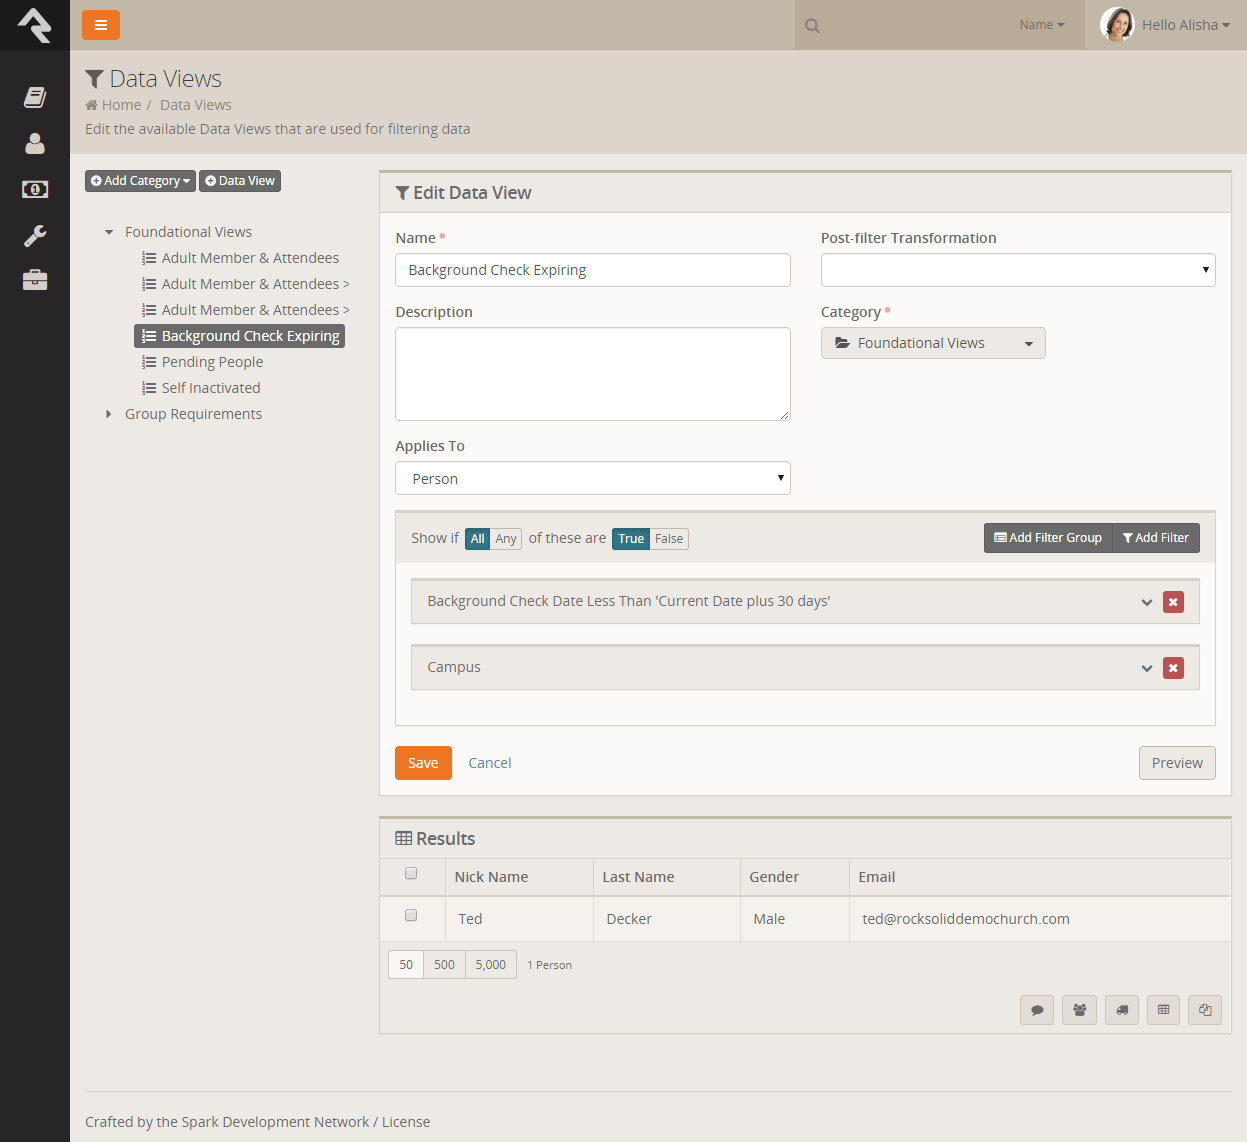
Editing a Data View
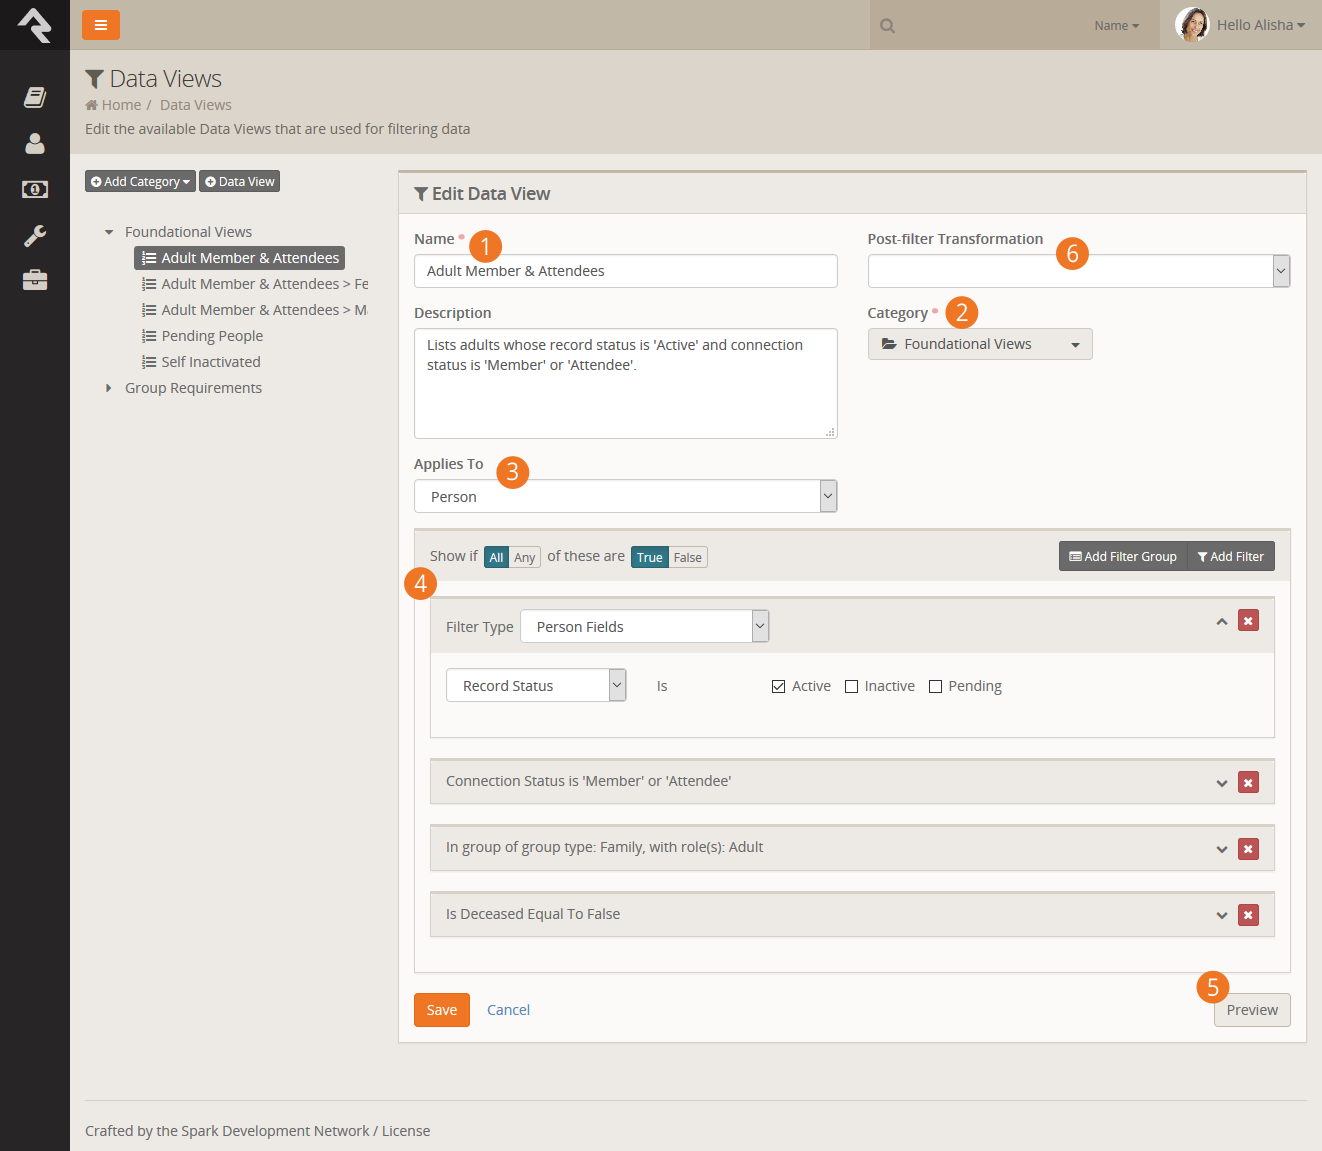
- 1 Name / Description
- The name and description of the data view. We highly recommend writing a detailed
description for your data view. Be sure to include how you intend the data view to be used.
- 2 Category
- The category the data view is assigned to.
- 3 Applies To
- The entity type that you will be filtering (e.g. person, group, campus, etc.)
- 4 Filters
- The filters used to define your criteria for limiting records.
- 5 Preview
- To help check your work you can select the 'Preview' button. This will show the first 15 rows
returned by your filters.
- 6 Post-filter Transformation
- This is where you can optionally select a post-filter transformation.
Next, let's look at the Adult Members & Attendees > Females
Data View. Initially you might expect to see a lot of the same criteria as the previous
Adult Members & Attendees
view with the addition of the female gender filter. Clicking the Edit
button you’ll see the data view strategy at work. Notice how the first criterion is
Include in Adult Members & Attendees
Data View? That says, "Take all of the filter criteria from the
Adult Members & Attendees
view and add it here." Then, all we need to do is add the additional gender filter.
Now, let's say in the future you'd like to enhance the definition of
Adult Members & Attendees
by ensuring that the age of the individual is over 18. You can add this to the base view
and it will dynamically apply to all subsequent views that use it.
Any vs All
At the top of the filter group you’ll notice a setting that says
Show if Any/All of these are true.
You might be wondering what’s the difference between Any
and All. Let’s define each:
-
All: This means that each of the filter criteria must be true in
order for a record to be displayed. One helpful trick is to read through each
filter and insert the word and
in between each. So for a record to display in the Adult Members & Attendee
view, a record must: have a record status of active AND a connection status of
member or attendee AND must be an adult in a family.
-
Any: This setting means that if Any
of the filter criteria is true then display the record. It's like inserting the
word OR between each criterion.
If You Forget:
If you forget the difference, read the Filter
summary on the data view detail view. It writes out the criteria inserting
AND
or OR for you.
Filter Groups
For complex views you may need to include both AND
and OR type logic
into your view. Filter groups give you this option. Say for instance you need to
create a view that shows individuals who are married AND a member OR who are single
AND an attendee. That data view would be configured like this:
Filter Groups
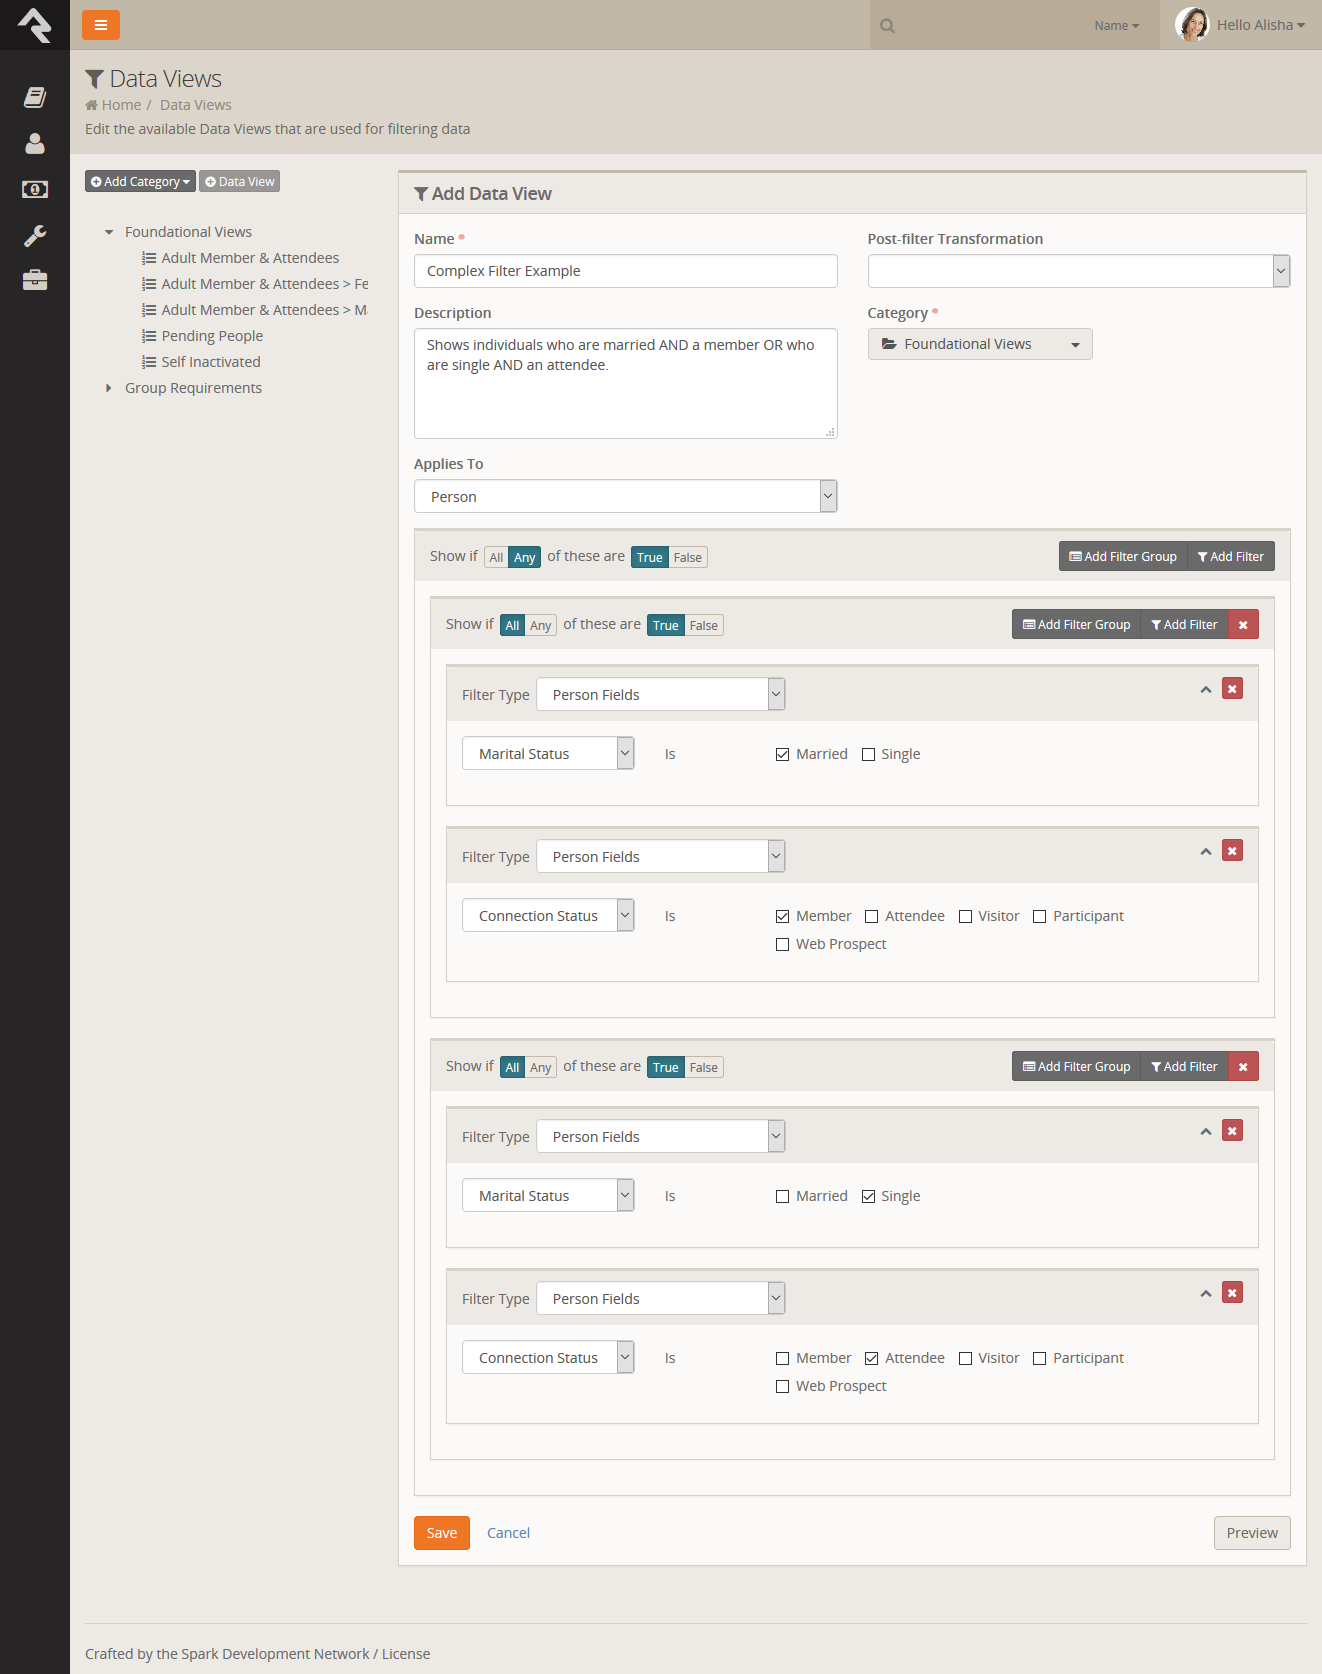
Note how we have two filter groups where if Any
of them is true the record is selected. They in turn have criteria that must
All match.
Post Filter Transformations
The Post-Filter Transformation gives you the option to "flip" the results of a Data View
with ease. For example, if your Data View includes the kids attending summer camp,
selecting the Parent
transformation will find the parents of those kids. If your Data View includes
Adult Members & Attendees,
choosing the Children
transformation will select the children of those selected.
Securing Data Views
There will be Data Views that you want to limit access to. Note that you can control
who has access to Data Views. To change the default security on a Data View click the
button on the data view details screen.
You can also check the access for Data View categories. This allows you to modify the
security for all Data Views in that category.
Taking Security Further
Controlling who has access to Data Views is important. But you also need to limit who
can make new Data Views with certain criteria. You can limit what filters are
available to specific users and groups under
Admin Tools > System Settings > Data Filters.
Here you'll see a list of available filters with the ability to change who has access
to use each filter.
When filtering on the attributes of an entity (like person attributes), normal
attribute security will be used in controlling access.
You can also control security on the Data View transforms. This can be configured
under Admin Tools > System Settings > Data Transforms.
Let's Go Farther:
You can create your own post filter transforms and custom filters. Doing this
does take some programming knowledge but it's possible. See our developer docs
for more information.
Displaying Data Using Reports
Now that we've selected the records we need, we're ready to define how we want our report
to display. Usually this means adding fields to our report. Let’s see how this is done.
Reuse Is Good:
Separating the filtering from the display also has the added benefit that reports with
separate display features can use the same filtering logic. In many systems you would
have to redefine the same filters twice. This is a lot of extra work, and it's a
nightmare to keep consistent over time.
You define your reports under Tools > Reports.
Like their Data View cousins,
reports are also organized using hierarchical categories.
Report Details
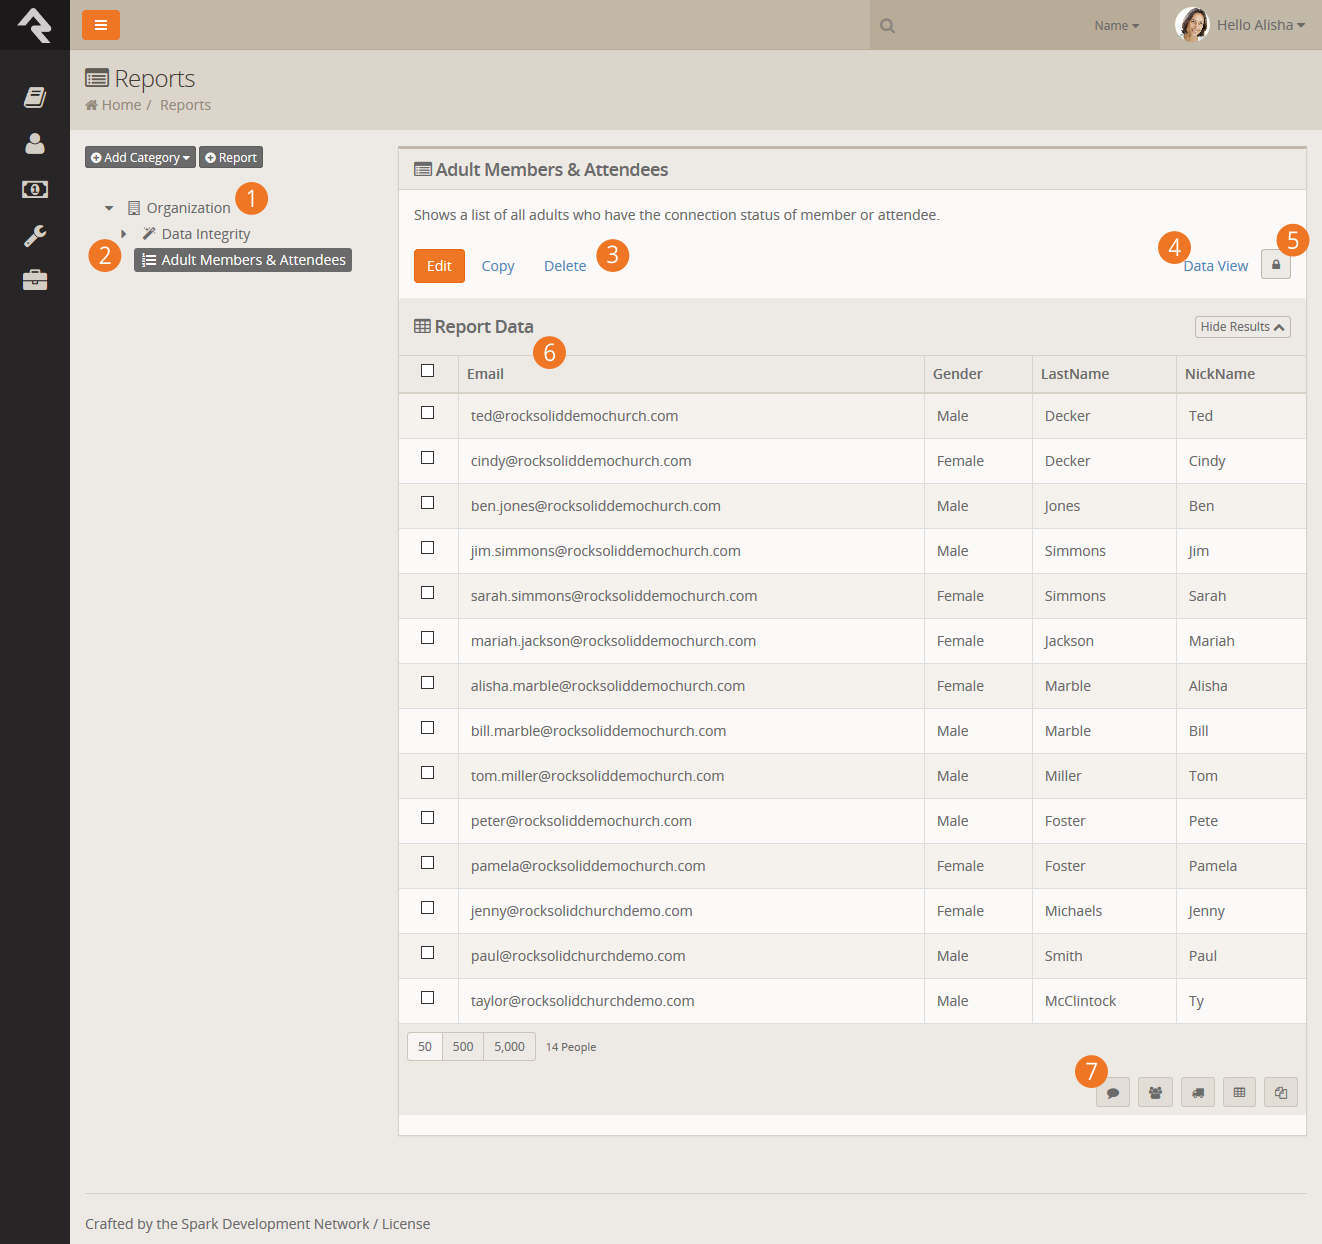
- 1 Categories
- Reports are also organized into hierarchical categories..
- 2 Report List
- List of reports for the selected category.
- 3 Report Details
- The details for the selected report.
- 4 Data View
- A link to the data view that drives this report.
- 5 Security
- Reports can be secured to limit access to who can view them.
- 6 Results
- The report results.
- 7 Grid Actions
- The data from reports can be used to send communications, export to Excel, or other actions
appropriate to the entity they refer to.
Creating A Report
Let's jump right in and see how we create a new report. For our example, we'd like to
create a report we can use to learn the names and faces of our members and attendees.
The figure below shows what this report would look like. The callouts for the figure
explain the various steps used in the creation of our report.
Editing a Report
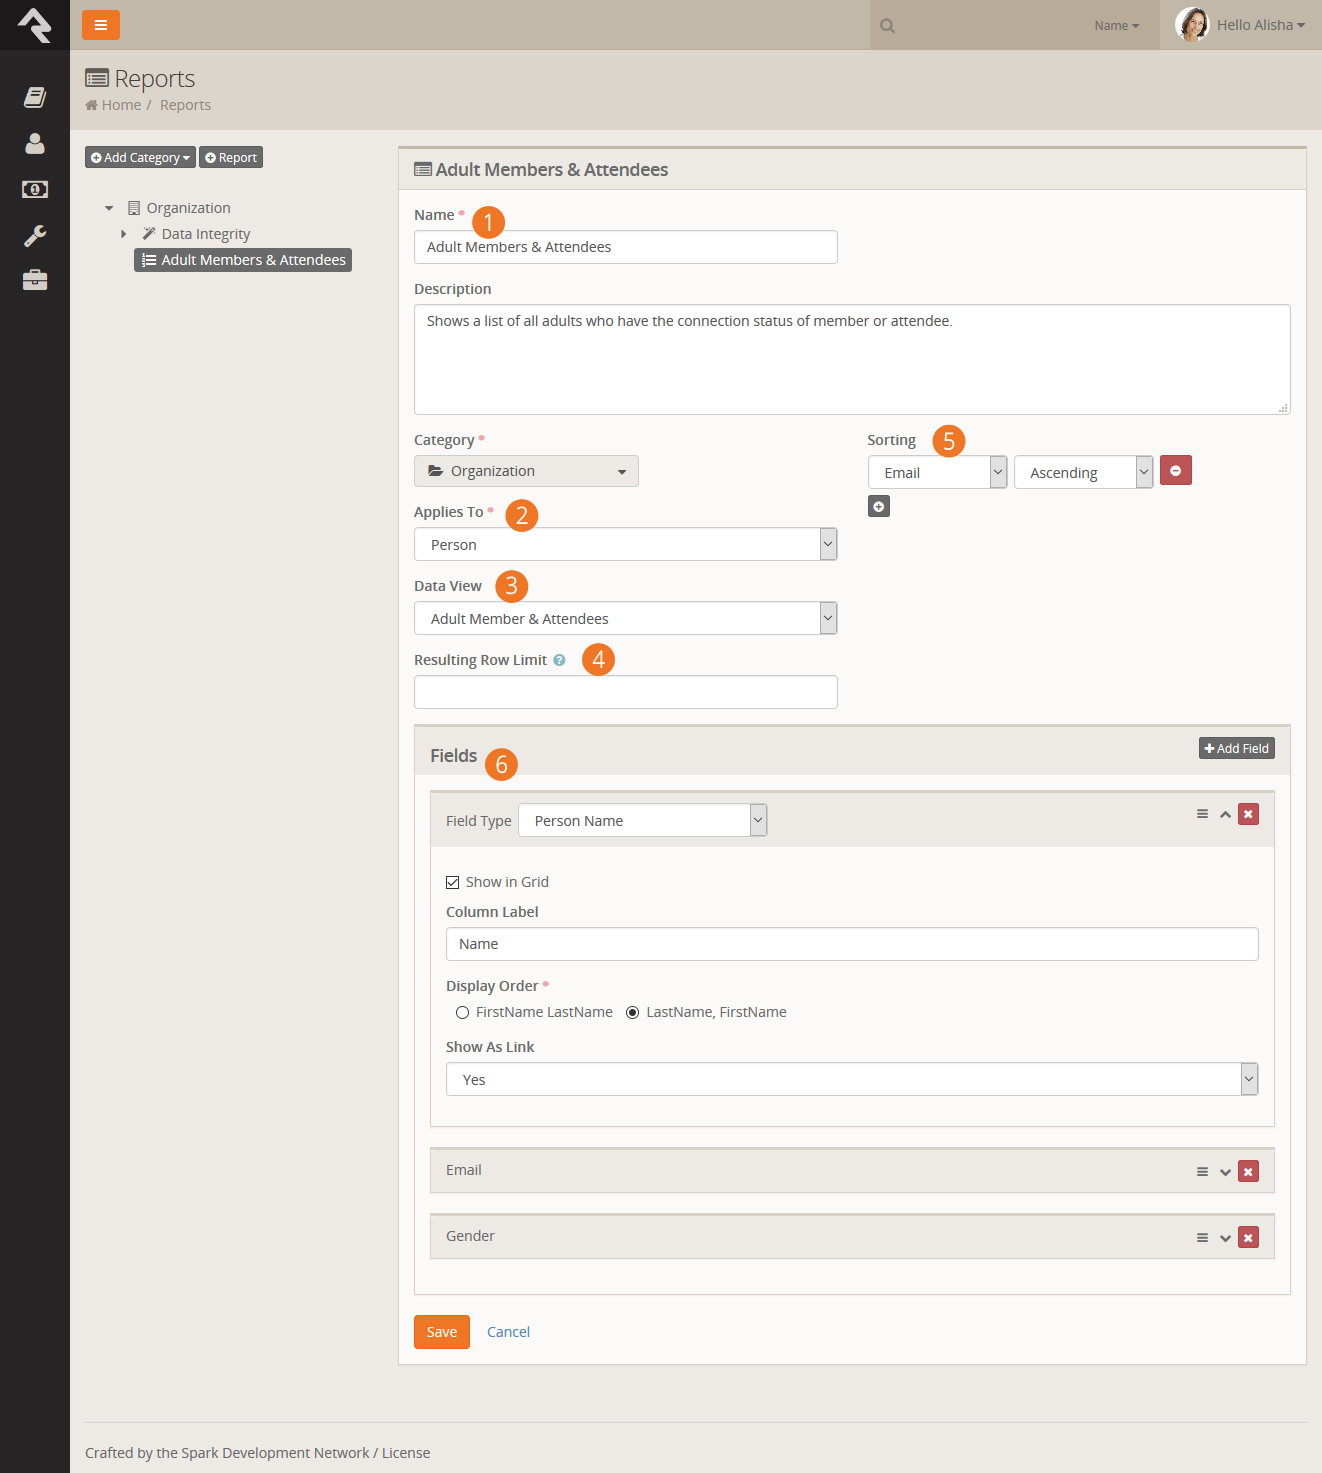
- 1 Name / Description
- First we give our report a name and description. We highly recommend that you
spend some time writing a clear description that tells what the report does and
how it should be used.
- 2 Applies To
- Next, select what type of entity you are writing a report for. In most cases this
will be Person
but, like Data Views, you can report on anything.
- 3 Data View
- Now that you have selected the entity, you'll see a list of
Data Views
you can use as the source for your report.
- 4 Resulting Row Limit
- If needed, you can limit the number of records that are displayed on your report.
- 5 Sorting
- You can sort your report by any field you add in either assending or decending order. You
can even choose to sort on more than one field at a time.
- 6 Fields
- Finally you'll add the fields you want to display on your report. You can
determine for each field whether or not you want it to display in the grid. You
might be thinking, "If it's not on the grid where else would I see it?" If you
don't check this button, the field will still be available when you export the
report to Excel from the bottom of the grid. This is helpful for supporting
information that is not needed very often.
The Power Of Lava
You'll notice that one of your field options is Lava.
Lava is a templating engine that allows you to customize the way data is presented.
With this field type you can mix and match data in lots of different ways.
One Caveat:
Every field you would like to use in your lava must be included in your report.
For instance, if you want to use the First Visit
date in your lava, you have to have that field in your report already. (You can
disable showing the field in the grid if you wish.)
Here are a few examples:
Last Name, Nick Name
{{ LastName }}, {{ NickName }}
Last Name, Nick Name as a link to the ‘Person Profile’ page
<a href="/Person/{{ Id }}">{{ LastName }}, {{ NickName }} </a>
If baptized, show field as a checkmark
{% if BaptismDate != null %}
    <i class="fa fa-check"></i>
{% endif %}
You can find out more about Lava on the Rock RMS learning website.
If you want more information on using Lava in merge documents, you'll find that in the Admin Hero Guide.
Let's Go Farther:
You can also create your own custom report fields with some developer knowledge. See
our developer docs for all the details.
Dynamic Report Block
As you create reports you may find that you need to duplicate Data Views and Reports to solve similar problems. For
instance, your organization may want a list of people who have a background check expiring in the next 30 days. Let's say the
report will be used at each of your campuses. You might be tempted to create a data view and report for each
campus, but there is an easier way.
Rock provides a block entitled Dynamic Report
that shows a specific report but also allows you to display specific
filters of the report’s underlying data view and allow the user to modify them. Let’s see our report in action
with the use case of our class.
Dynamic Report Block
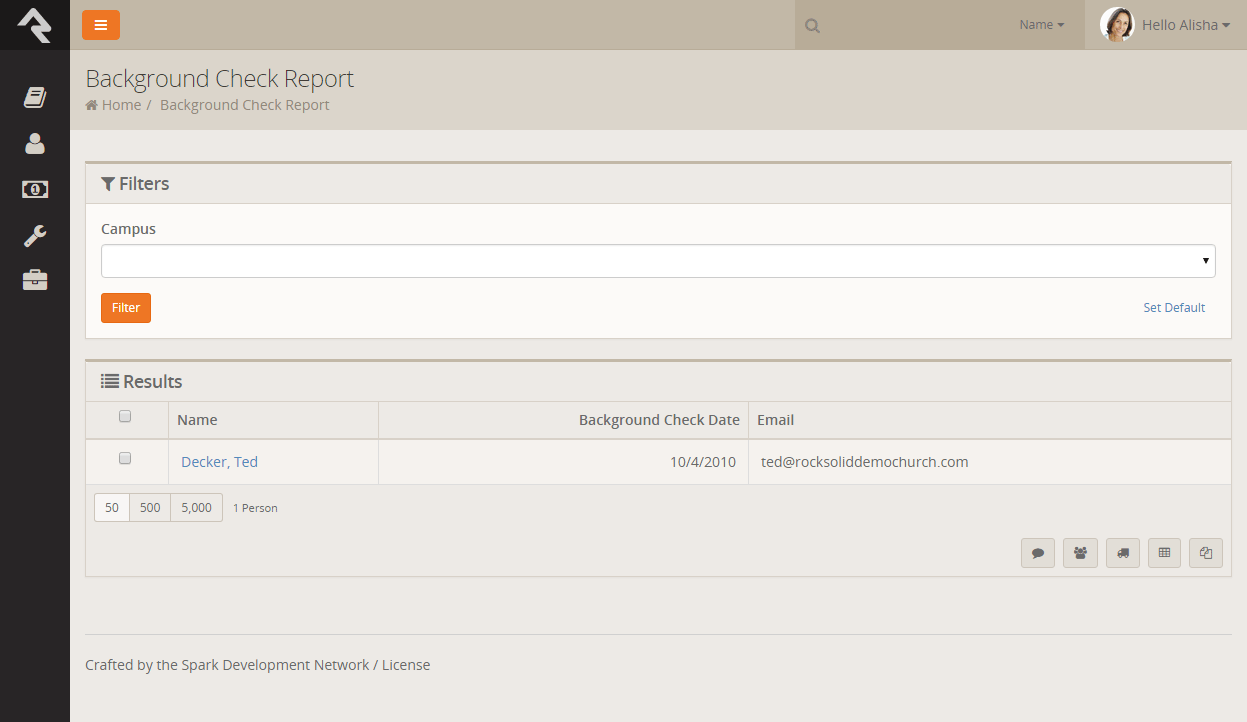
As you can see, the block looks like the standard report grid with the
addition of a filter list from the data view. Let's walk through the steps to recreate this.
Create Data View
The first step is to create the data view under Tools > Data Views
that will drive the report. Here we have two filters: campus and our background check logic. Notice that we
leave the campus blank. This basically says "show any campus," which will be our "default."
Data View Configuration
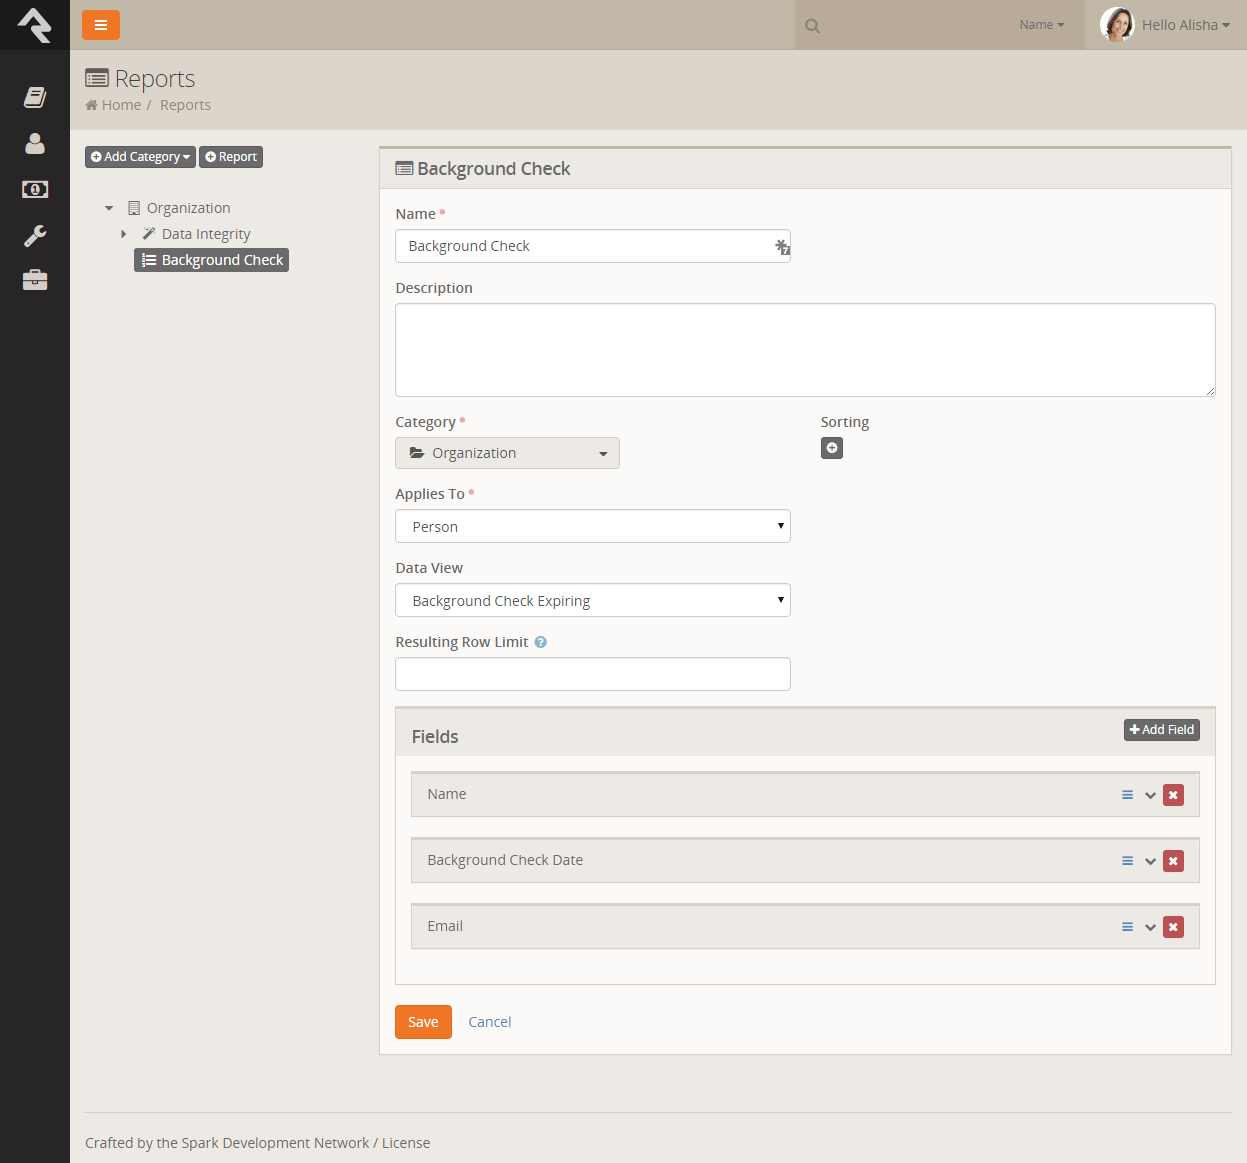
Create Report
Next we create the report under Tools > Reports. Here
we add in the columns we’d like to display on the report. Nothing new here.
Report Configuration
Setup Dynamic Report
Finally, we’re ready to add our Dynamic Report block. After
creating a new page and adding the block, we can set the block's settings. Below is a screenshot of what's possible.
Block Settings for Dynamic Report
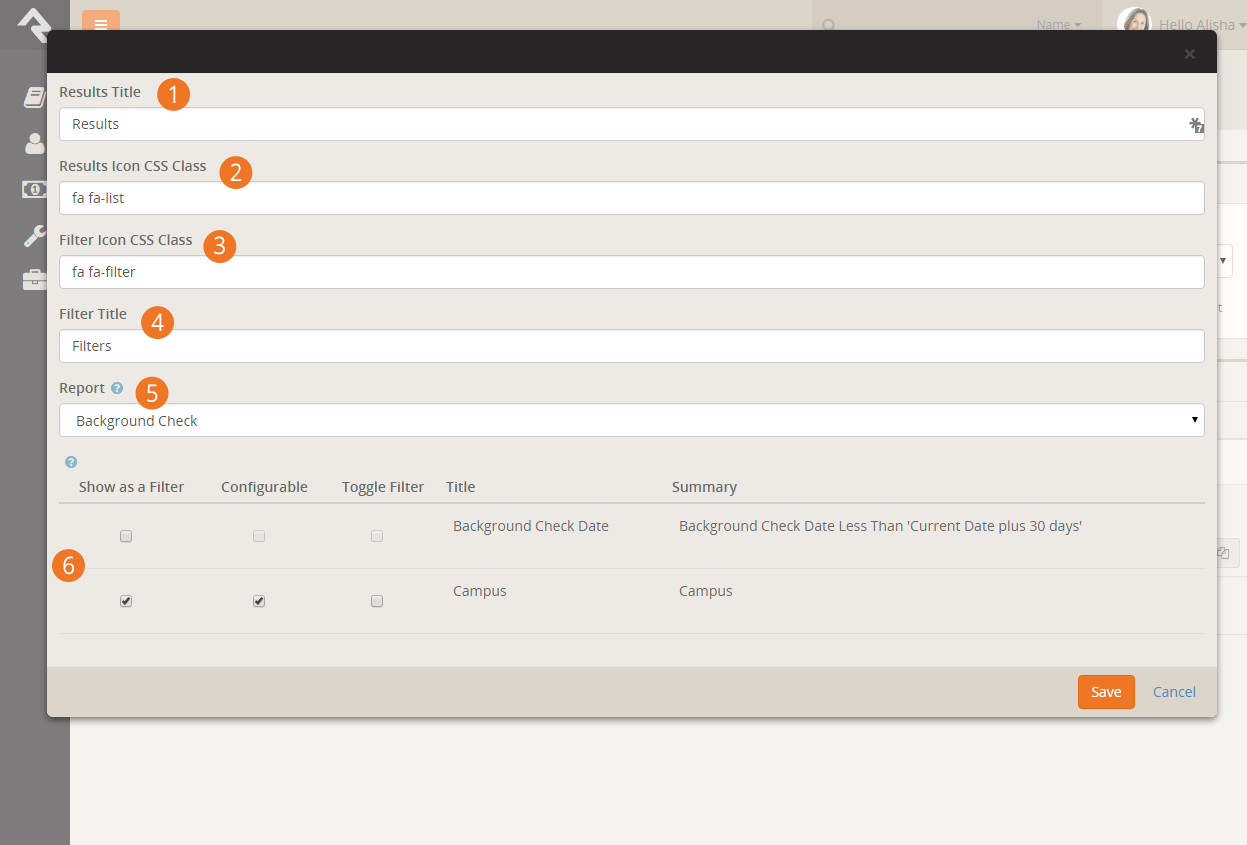
- 1 Results Title
- The title text to use for the results grid.
- 2 Results Icon CSS Class
- The CSS icon to use for the same grid.
- 3 Filter Icon CSS Class
- The CSS icon to use for the filter panel.
- 4 Filter Title
- The title text for the filter panel.
- 5 Report
- The report we created in step 2.
- 6 Filter List
- After selecting a report, Rock will look at the data view for that report and list its filters. The options include:
- Show As A Filter: This tells the block whether the filter should be shown to the
user for them to modify. In our sample we let them change the campus but not the background check date.
- Configurable: Determines if the user should be allowed to modify the criteria of the filter.
At first you might think this odd, as when would you ever not want to allow the criteria to change, but it'll
make sense when combined with the next option.
- Toggle Filter: This setting will show the filter with a checkbox next to it. Unchecking the box will
disable the filter entirely.
Filter Limitation
When showing the filters, the block will only list filters on the top-most data view. If your data view inherits from another view, you won’t be able to augment its filter settings.
The Dynamic Report block is very powerful. Once you create your
first one, you'll find it's one of the most popular tools in your toolbox.
Dynamic Data Block
You should be able to use data views and reports to meet most of your reporting
requirements. If you have a special requirement that can’t be met, or you prefer a
different user experience than what reports provide, there is the Dynamic Data block.
When you add a dynamic data block to a page (see the
Designing and Building Websites with Rock
for details on adding blocks to pages), you have the ability to craft the display of
filtered data. Let's walk through the various options of this block.
Dynamic Data Block
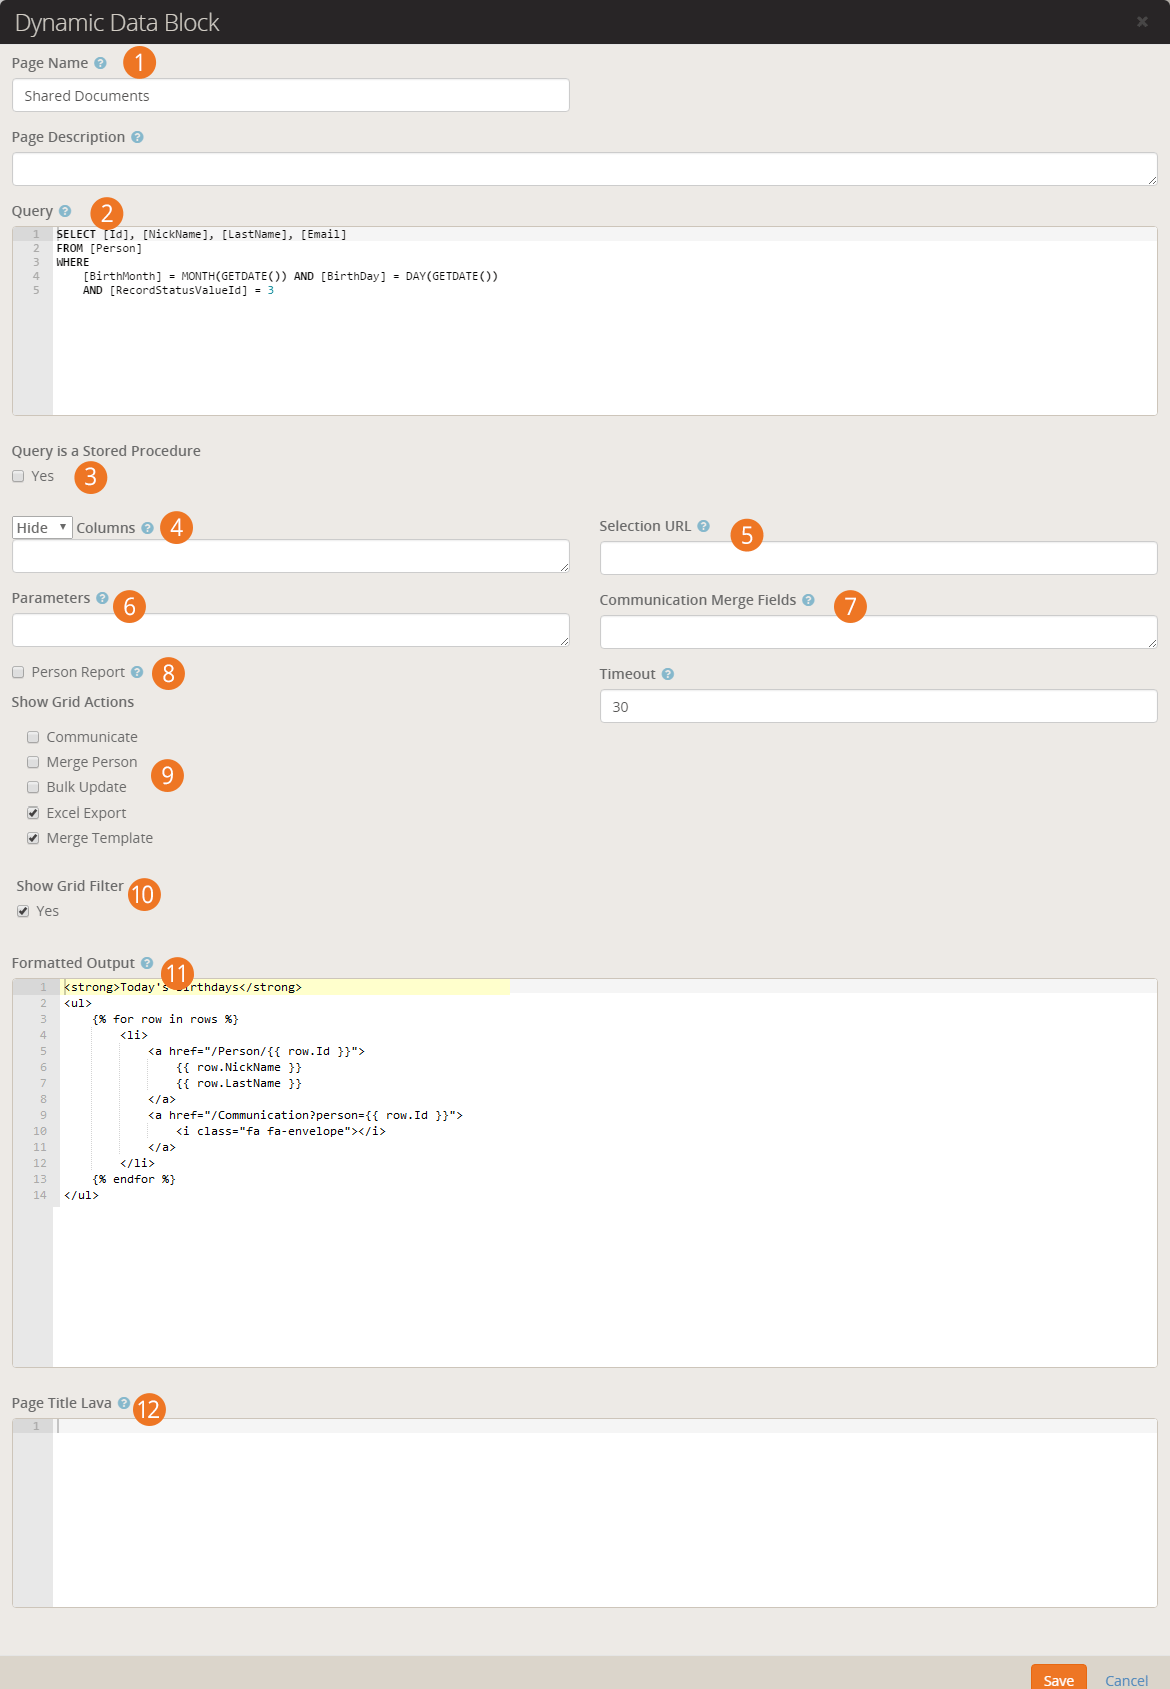
- 1Page Name/Description
- This allows you to reset the title and description of the page from within the block.
- 2Query
- This is the SQL query or stored procedure call (more on procedures below) for defining
the data to be displayed. SQL is a standard reporting language used by most databases.
There are plenty of resources online for learning its syntax.
- 3Query is a Stored Procedure
- This setting tells Rock that you will be calling a stored procedure vs a straight SQL statement. This
allows Rock to configure any parameters needed for the stored procedure.
- 4Column Display
- By default all the columns returned by the SQL query or stored procedure will be displayed.
This setting allows you to specify that only some columns should be shown, or some columns
should be hidden. This is helpful if your SQL defines several columns that you want to be
displayed when exporting to Excel, but you want a limited subset to display on the page.
- 5Selection URL
- The url someone is redirected to when they click on a row in the grid. Any column's
value can be used in the url by including it in braces. For example, if the grid includes
an Id column that
contains Person Ids,
you can link to the Person view, by specifying a value here of '~/Person/{Id}.
- 6Parameters
- When using stored procedures, you can pass in parameters to create dynamic filters.
More on this feature is covered below in the
Extra Power from Stored Procedures.
- 7Communication Merge Fields
- List any field you want to be available on the communications page as merge fields.
- 8Person Report
- If your query returns a list of people, you'll want to check this box. It will enable
several features that are specific to listing individuals. For instance, the grid will
contain a link to the communications page. Be sure that your query returns the
Id field so that these
features will work as planned.
- 9Show Grid Actions
- Lets you pick which grid actions are available on the dynamic report.
- 10Show Grid Filter
- This setting will create and show a series of filters for the grid. Rock will attempt to create a filter for each
column on the grid.
- 11Formatted Output
- By default, the query will be show as a grid on the page. If you'd prefer, you can
provide a lava template that will be used to transform the data into your own custom
layout. This is incredibly powerful because you can start to create your own
mini-applications
using these dynamic data blocks for displaying data.
- 12Page Title Lava
- This allows you to set the page's title with lava. You can also use data from the result set(s).
Source From the Example
Below is the source from the sample above.
SQL
SELECT [Id], [NickName], [LastName], [Email]
FROM [Person]
WHERE
    [BirthMonth] = MONTH(GETDATE()) AND [BirthDay] = DAY(GETDATE())
    AND [RecordStatusValueId] = 3
Lava
<strong>Today's Birthdays</strong>
<ul>
    {% for row in rows %}
        <li>
            <a href="/Person/{{ row.Id }}">
                {{ row.NickName }}
                {{ row.LastName }}
            </a>
            <a href="/Communication?person={{ row.Id }}">
                <i class="fa fa-envelope"></i>
            </a>
        </li>
    {% endfor %}
</ul>
Important! When writing your query it is important the the [Id] field for the person starts with a capital 'I'. If not
links to send communications will not work.
That Figure Is More Than An Example...
The settings for the example above will list out all the people in the database whose birthday is the
current date as a bulleted list linked to send an email. Throw that on your internal homepage and go
buy yourself a coffee!
Extra Power from Stored Procedures
OK, we're going to geek out here for a second... By using
SQL Server Stored Procedures, it can get even more powerful. When calling a stored
procedure you can pass the procedure any of the query string parameters from the URL.
For instance, if the page the block is placed on is accessed from the URL:
http:///page/123?GroupID=12
You can pass the value of the GroupId to your stored procedure as a parameter. The
stored procedure can then use this value to help return relevant data (say group
members for the group).
You can also pass in the current user's person id field. This allows you to further
personalize the data to the person requesting the page. Just think of all the fun you
can have with this block!
In order to make this all work, you'll need to define each of the parameters you want
passed to your stored procedure in the Parameters
field discussed above. Rock will look for each of these parameters in the URL’s query
string and, if found, pass in the value to the procedure. If you would like the
current person’s id to pass in you'll likewise need to add in the parameter
CurrentPersonId.
Inception Time:
This functionality gets truly powerful when you have dynamic data blocks calling
dynamic data blocks. So, you might have one dynamic data block that lists every
serving group in your database. Then it links to a different page passing the
selected group id, with a dynamic data block that shows the group members. Using
the lava template option, all of this can be designed to make the pages look
like custom application logic. BAM
Metrics
"What’s measured improves." – Peter Drucker
Using metrics can help provide your organization a framework for improvement by tracking
key performance indicators. Metrics describe what’s going on under the hood of your
organization.
Rock includes a full set of features for tracking and displaying metrics. First let's
walk through how we define metrics and then we'll look briefly at how we can present
metrics in some useful ways.
Example Metric
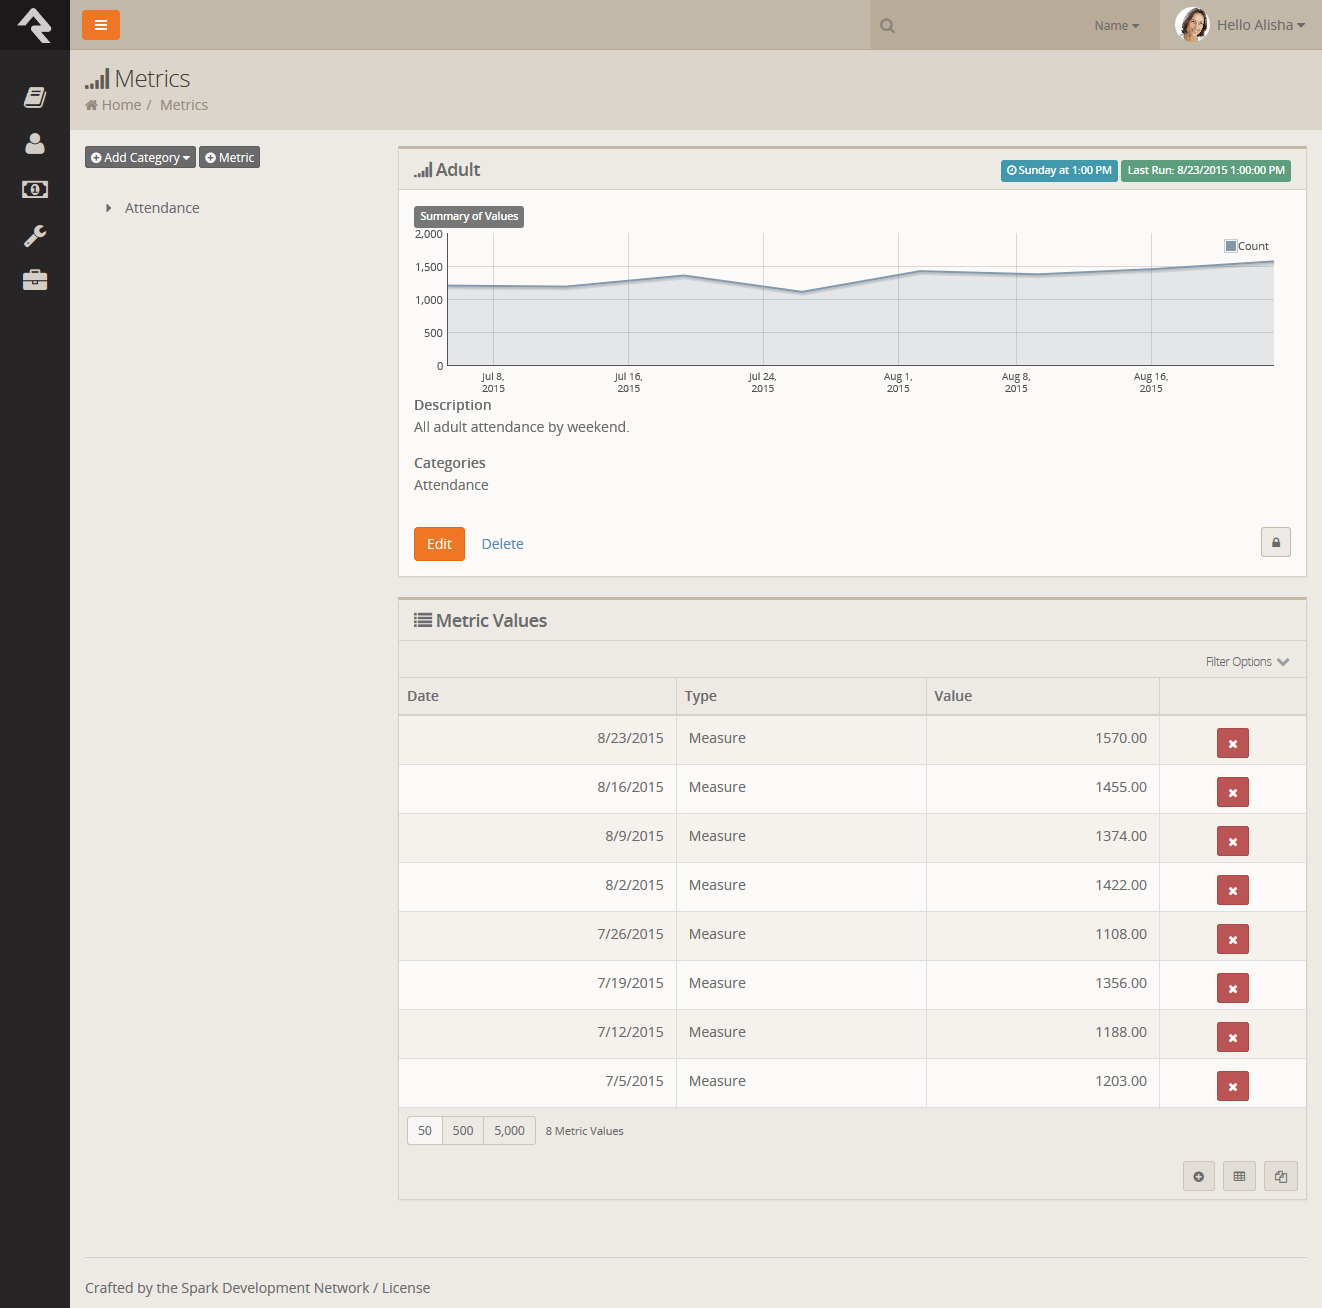
Anatomy of a Metric
Metrics are defined very similar to data views and reports with categories. This
allows you to organize them in a way that makes sense for your organization. One
thing that is unique about metrics is that they can be linked to more than one
category. This allows you to re-use them in several areas of your metric hierarchy.
So how do we create a new metric? Administrating metrics is done under
Tools > Metrics.
For our example we'll create a new metric that displays the number of adult members
and attendees we’ve had each week. Here are the details of the completed metrics with
callouts for each field.
Metric Edit
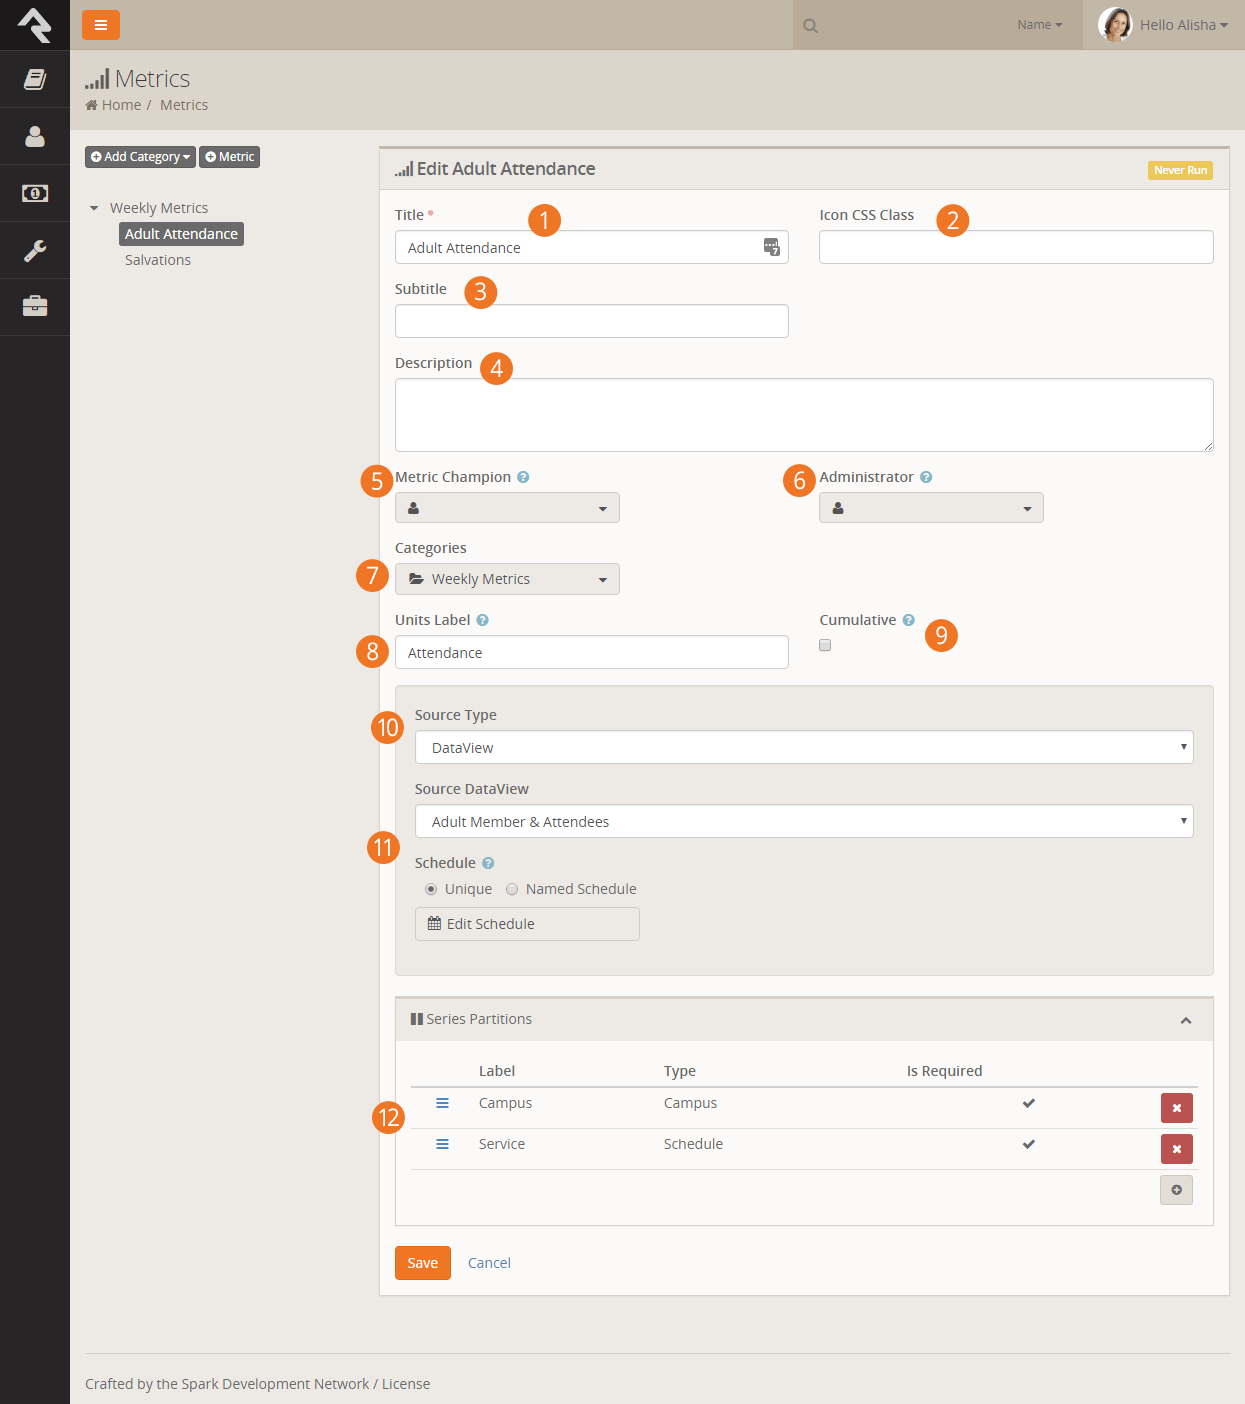
- 1Title / Subtitle / Description:
- Be sure to provide detailed titles and descriptions for your metrics that not only
make sense to you, but also to those who will be using the metrics in the future.
- 2Icon CSS Class:
- The CSS class of the icon you wish to associate to the metric. This is used in the
display of the metric. Rock uses the Font Awesome
icon set by default, but any CSS based icon set can be used if properly configured.
- 3Subtitle:
- The subtitle will be shown on graphs and charts.
- 4Description:
- You'll be tempted to just skip right over this field, but you'll regret that in the future. No matter
how obvious you feel this metric is future you is screaming for you to add details about what is being
measure, how it's calculated, any filter specifics (like only members), etc. Be kind to future you
and document as much as you can. When you're done, go ahead and thank youself ahead of time.
- 5Metric Champion:
- One of the keys to good metrics is good documentation. In that regard we’ve
worked hard to be sure that metric become self-documenting. The metric champion
allows you to note the person in your organization who is responsible for confirming
that this metric is meeting its goals.
- 6Metric Administrator:
- The metric administrator is the individual in your organization who is
responsible for ensuring that the metric data is entered correctly and is valid.
- 7Categories:
- This field allows you to link your metric to one or more categories.
- 8Units Label:
- The y-axis label describes the units of what is being measured (people, groups,
money, etc.)
- 9Cumulative:
- Some metrics make sense to compare year-to-date, others - not so much. For
instance, it's often helpful to look at year-to-date values for adult members and
attendees.
But a metric that tracks attendance for a service or event often does not make sense
to evaluate the same way. This field allows Rock to know if cumulative comparisons
make sense for this specific value.
- 10Source Type:
- The source type defines how the metrics will be entered into the system. The options are:
- Manual: Metric values will be entered in manually.
- SQL: A SQL statement will be run to populate the values. Once you select this option a SQL entry input will be displayed. The help menu for the
SQL field provides in-depth information on how your SQL should be formatted.
- Data View: A data view will be executed and the count of its values will be added
to the metric with the date it was run. The help field here also displays information on configuring your dataview.
- 11Schedule:
- The metric schedule helps determine how often this metric is calculated. When
used with the SQL and data view source types, this field will actually tell Rock
when to automate the harvesting of metric values.
- 12Series Partitions:
- For simple metrics you're done, you can skip this section. Often times though you want to break
your metrics down by campus, or maybe campus then service time. Setting up series partitions allows
you to do just that. You always get the date partition (that's free) but you can setup as many partitions
as you feel necessary (but more that 2 can get a bit complex).
Entering Metric Values
There are two types of metric values you can enter. Each one is discussed in detail below.
Example Metric
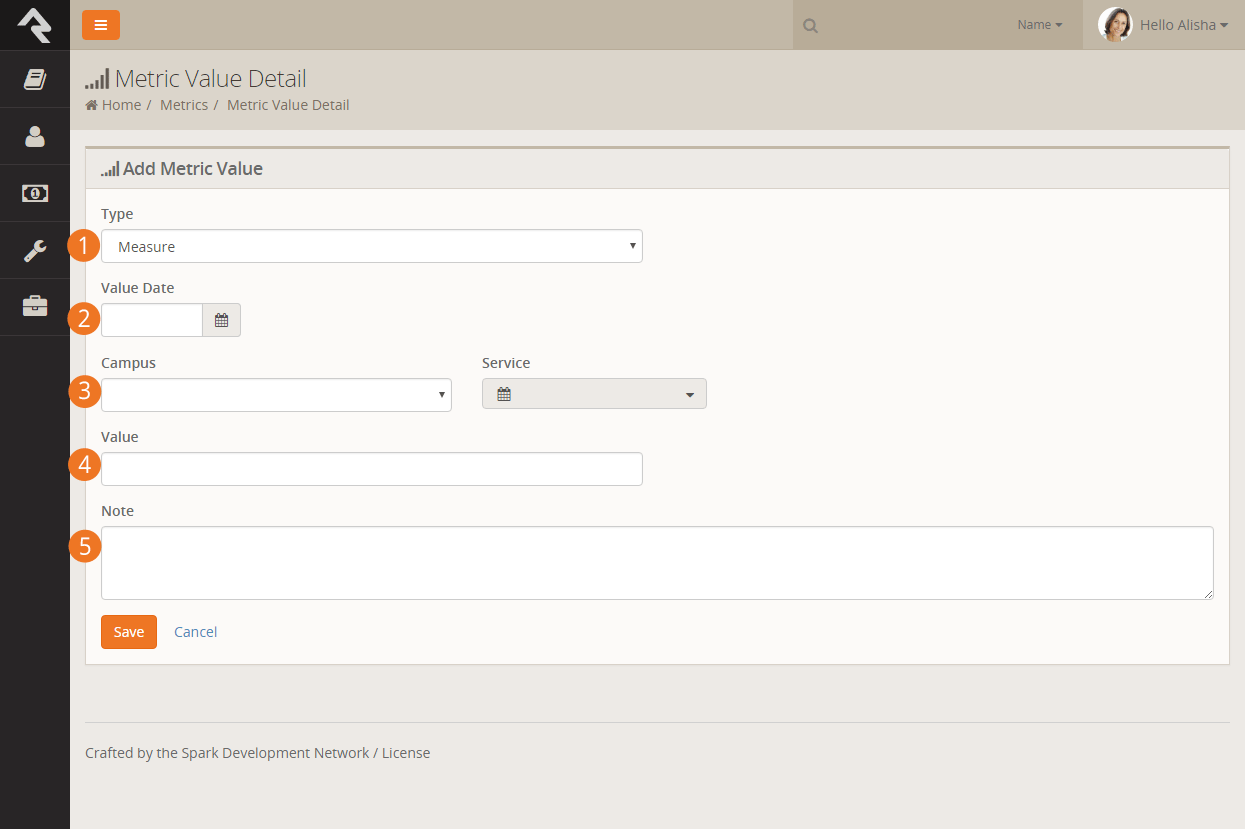
- 1Type
- The first entry denotes if this is a measure or a goal. More on the difference between these
two below.
- 2Value Date
- The date that the value is for.
- 3Series Partitions
- If you configured any series partitions you'll need to select their values here.
- 4Value
- The metric measure or goal value.
- 5Note
- A note for the value. This is a great place to document special outliers (like Christmas or Easter) or additional data (like the week's sermon title).
Measures
Measures are the actual values for a metric. In most cases they contain a
date/time and a value. You also have the option to provide a note. This is
helpful to explain outliers or special situations.
Goals
It's often good to track goals for your metrics. This lets you see how well
you're actually doing. Goals can be entered with broad date ranges if you
want. For instance, if you'd like to set a single goal value for the entire
year, you could simply add two goal values. One for January 1 and the other
for December 31.
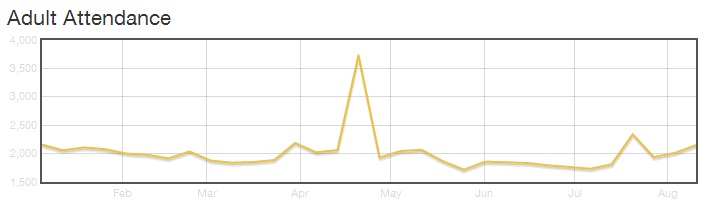
Metric Charts
The easiest way to view metrics values is to look at the charts that appear above the
metric definition. This will show you all of the values entered for the metric. If
you would like to have more options for displaying metrics, take a look at the metric
dashboard capabilities below.
Service Metric Entry
You'll often have the need to enter metrics that follow the partition pattern of "Campus > Sunday Date > Service Time" pattern. We've created
a simple entry page for you to enter these types of metrics into. You'll find this page under
Intranet > Weekly Metrics. There are several block settings to allow you to configure
the block and select the metrics you wish to enter.
Metrics Dashboards
We've seen that metrics provide a limited graphing capability for viewing their values.
What if you want to create enhanced dashboards for viewing your metrics? Rock ships with
several blocks to help you create rich dashboards based off of metrics.
Anatomy of a Dashboard
Dashboard Parts
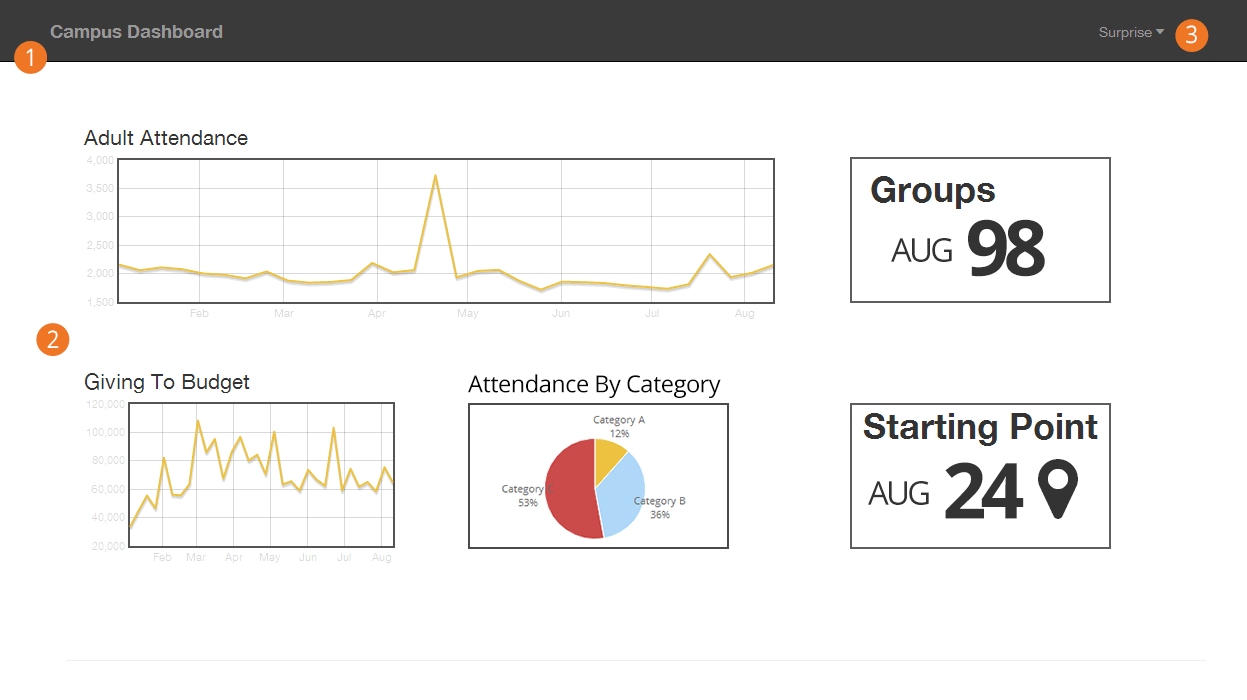
- 1Theme:
- While dashboard blocks can be placed on any page in Rock we do ship with a special
theme designed for dashboards called Dashboard Stark. This a very basic starter theme
for you to use as a starting point for creating your own. When you do create new
dashboard themes we highly recommend you prefix their name with
Dashboard
to help keep them grouped together in lists.
- 2Dashboard Widgets:
- The widgets are simply Rock blocks on the page. We discuss each type of block below
in detail.
- 3Context Setter:
- While optional, a context setting on the page allows you to filter the metric
values by their Series Partition.
Many times this is a campus selector or group selector.
Dashboard Blocks
Rock ships with several dashboard widget blocks. Each of these blocks is shown below.
Line Chart
Line Chart
This block displays a line chart for the selected metric. Options include:
| Title |
Description |
| Name |
This is the block name. It is not displayed anywhere on the output of the block. |
| Title |
The title that is displayed for the metric. |
| Subtitle |
The subtitle for the metric. |
| Column Width |
The number of Bootstrap columns the chart should use for its width. (A Bootstrap row, by default, has 12 columns.) |
| Chart Style |
The chart style to use. These styles are defined under Admin Tools > General Settings > Defined Types > Chart Styles. |
| Metric Value Types |
Determines what metric value types should be displayed on the chart, goals and/or measures. |
| Metric |
The metric to use for the chart. |
| Partition Filter |
Determines how the chart will get the series partition value. It can be either hard coded or determined from the page context. |
| Date Range |
Determines which values are displayed on the graph. |
| Detail Page |
This optional setting will determine which page will be loaded when the graph is clicked. |
Pie Chart
Pie Chart
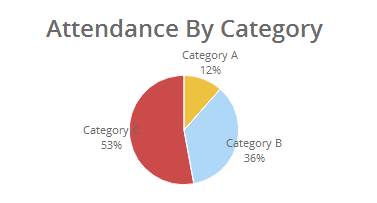
This block displays a pie chart for a given metric. Options include:
| Title |
Description |
| Name |
This is the block name. It is not displayed anywhere on the output of the block. |
| Title |
The title that is displayed for the metric. |
| Subtitle |
The subtitle for the metric. |
| Column Width |
The number of Bootstrap columns the chart should use for its width. (A Bootstrap row, by default, has 12 columns.) |
| Chart Style |
The chart style to use. These styles are defined under Admin Tools > General Settings > Defined Types > Chart Styles. |
| Metric Value Types |
Determines what metric value types should be displayed on the chart, goals and/or measures. |
| Metric |
The metrics to use for the chart. Each metric will represent one slice of the pie chart. |
| Partition Filter |
Determines how the chart will get the series partition value. It can be either hard coded or determined from the page context. |
| Date Range |
Determines which values are displayed on the graph. |
| Detail Page |
This optional setting will determine which page will be loaded when the graph is clicked. |
Lava
Lava Chart
This block renders the metric values using a lava template. Options include:
| Title |
Description |
| Name |
This is the block name. It is not displayed anywhere on the output of the block. |
| Title |
The title that is displayed for the metric. |
| Subtitle |
The subtitle for the metric. |
| Column Width |
The number of Bootstrap columns the chart should use for its width. (A Bootstrap row, by default, has 12 columns.) |
| Chart Style |
The chart style to use. These styles are defined under Admin Tools > General Settings > Defined Types > Chart Styles. |
| Round Values |
Round Y values to the nearest whole number. For example, display 25.00 as 25. |
| Metric |
The metrics to use for the chart. |
| Partition Filter |
Determines how the chart will get the series partition value. It can be either hard coded or determined from the page context. |
| LavaTemplate |
The lava template to render the output for display. |
| Detail Page |
This optional setting will determine which page will be loaded when the graph is clicked. |
Under Construction:
Work is still being done on the metrics dashboard features. Expect changes that
may impact configuration settings. Feel free to play with these features but don't
roll them out in production just yet.
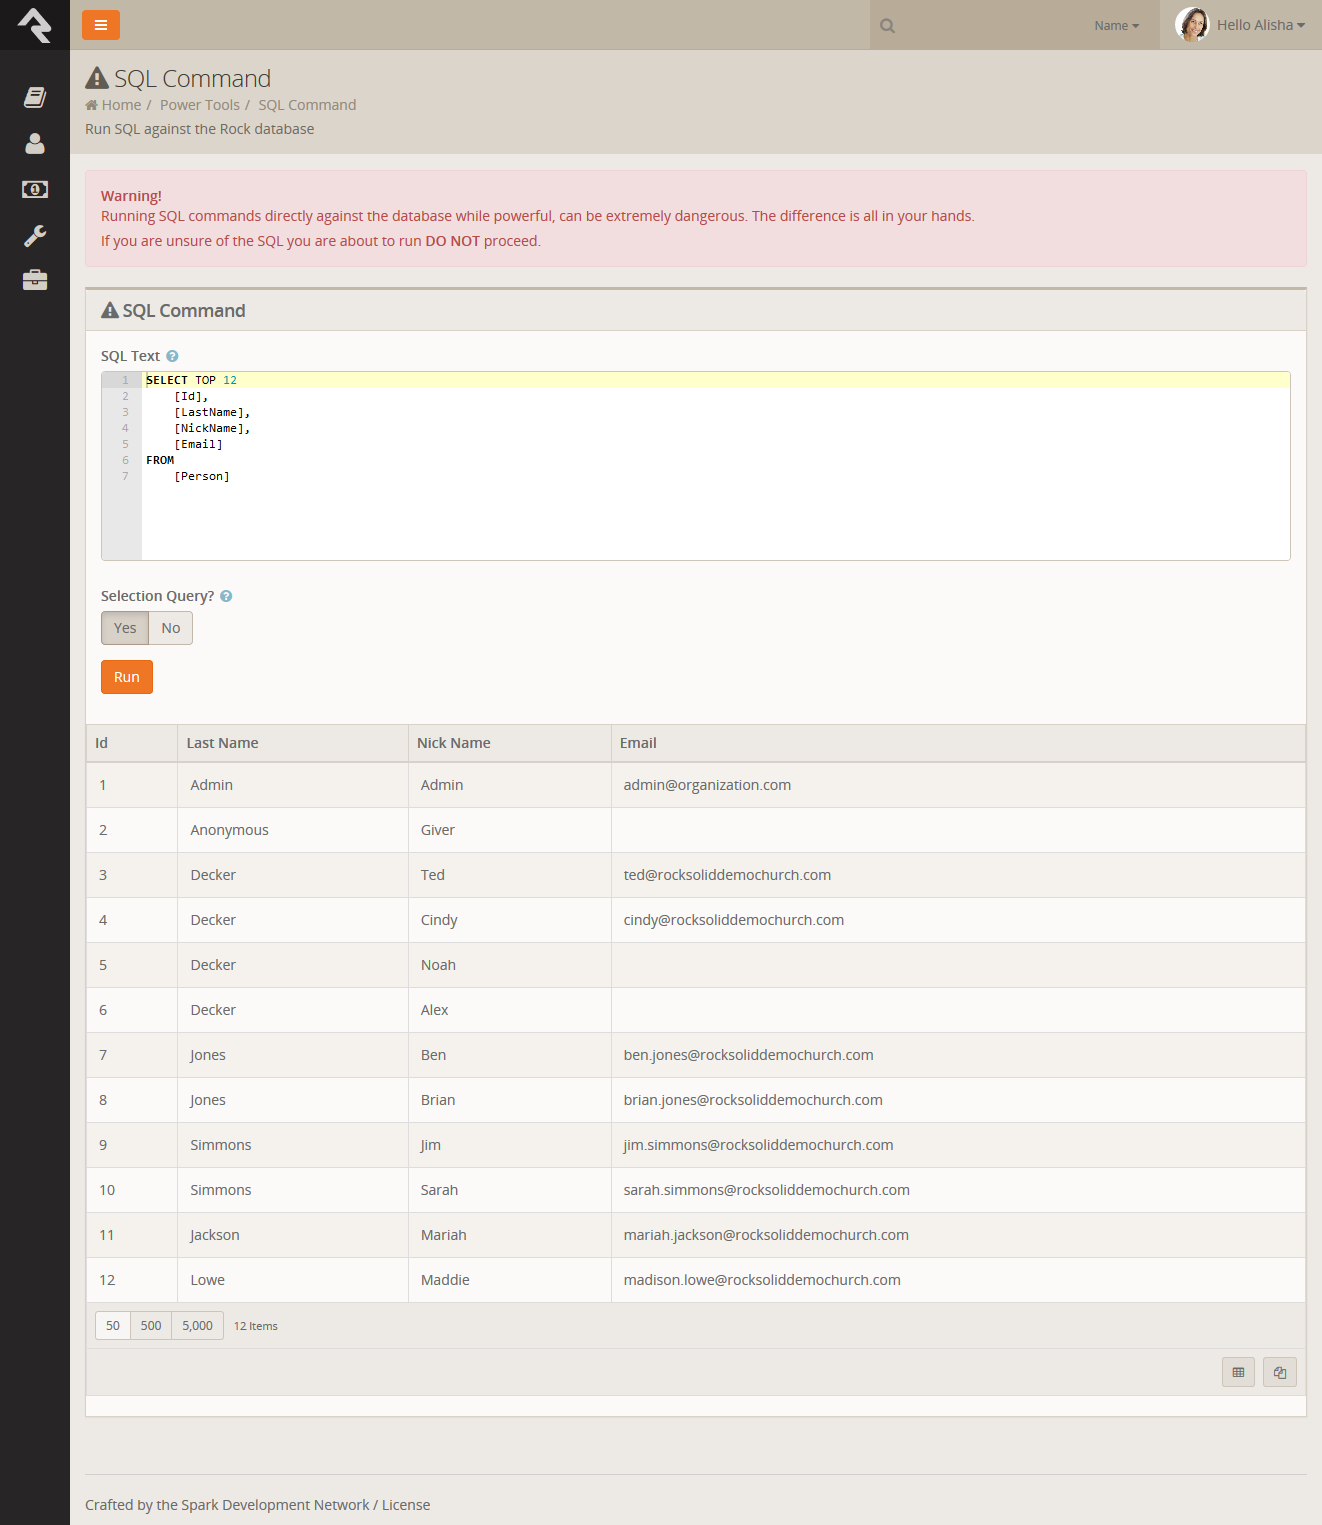
SQL Command
While not technically a reporting tool, the SQL Command page
(Admin Tools > Power Tools > SQL Command)
allows you to execute a SQL statement right in the browser. This makes it possible for
administrators and developers to perform many tasks without requiring SQL Server
Maintenance Studio.
Warning:
Special Care should be taken with this tool, since it does permit UPDATES to your
database. Since it is possible to quickly wipe out swaths of data, access to this
page/block should be minimized to people with something to lose in return.
SQL Command